Data Table
The table is the default visualization to display your result set when your query is finished processing.
When to use Table?
A table works well when you want to have a feel of your raw data, for example, if you want to quickly compare several variables.
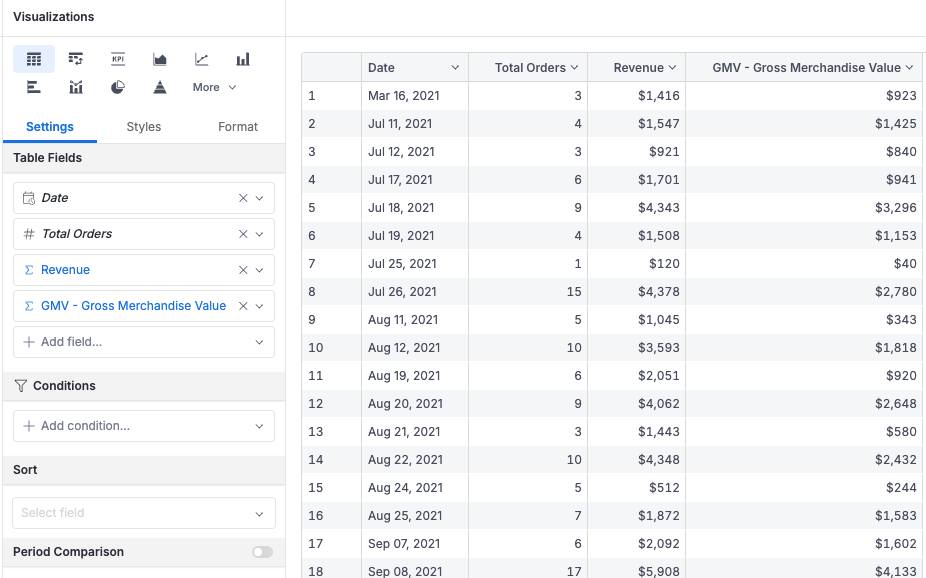
How to create a Table
- Open Report Builder or Dataset Exploration.
- Select the Table Visualization option
- Drag and drop the fields you want to visualize.
- Click Get Result button
You can also:
- Drag and drop columns/fields to reorder them.
- Customize the display name (label) of a field.
- Sort table columns.
- Apply filters to the table.
Show / Hide Columns
You can hide a column from a table in two ways:
- Click on any fields in the Visualization Settings and select Hide field.
- Click to open the Context Menu (arrow icon) of any columns in the table and choose Hide in view.
To unhide a column, click on that field in the Visualization Settings and select Show field.
This is an aesthetic feature, not a security feature. Hiding a column will remove it from the user’s report view and export, but the data is still accessible and not restricted in any way.
Styling Options
Table styles
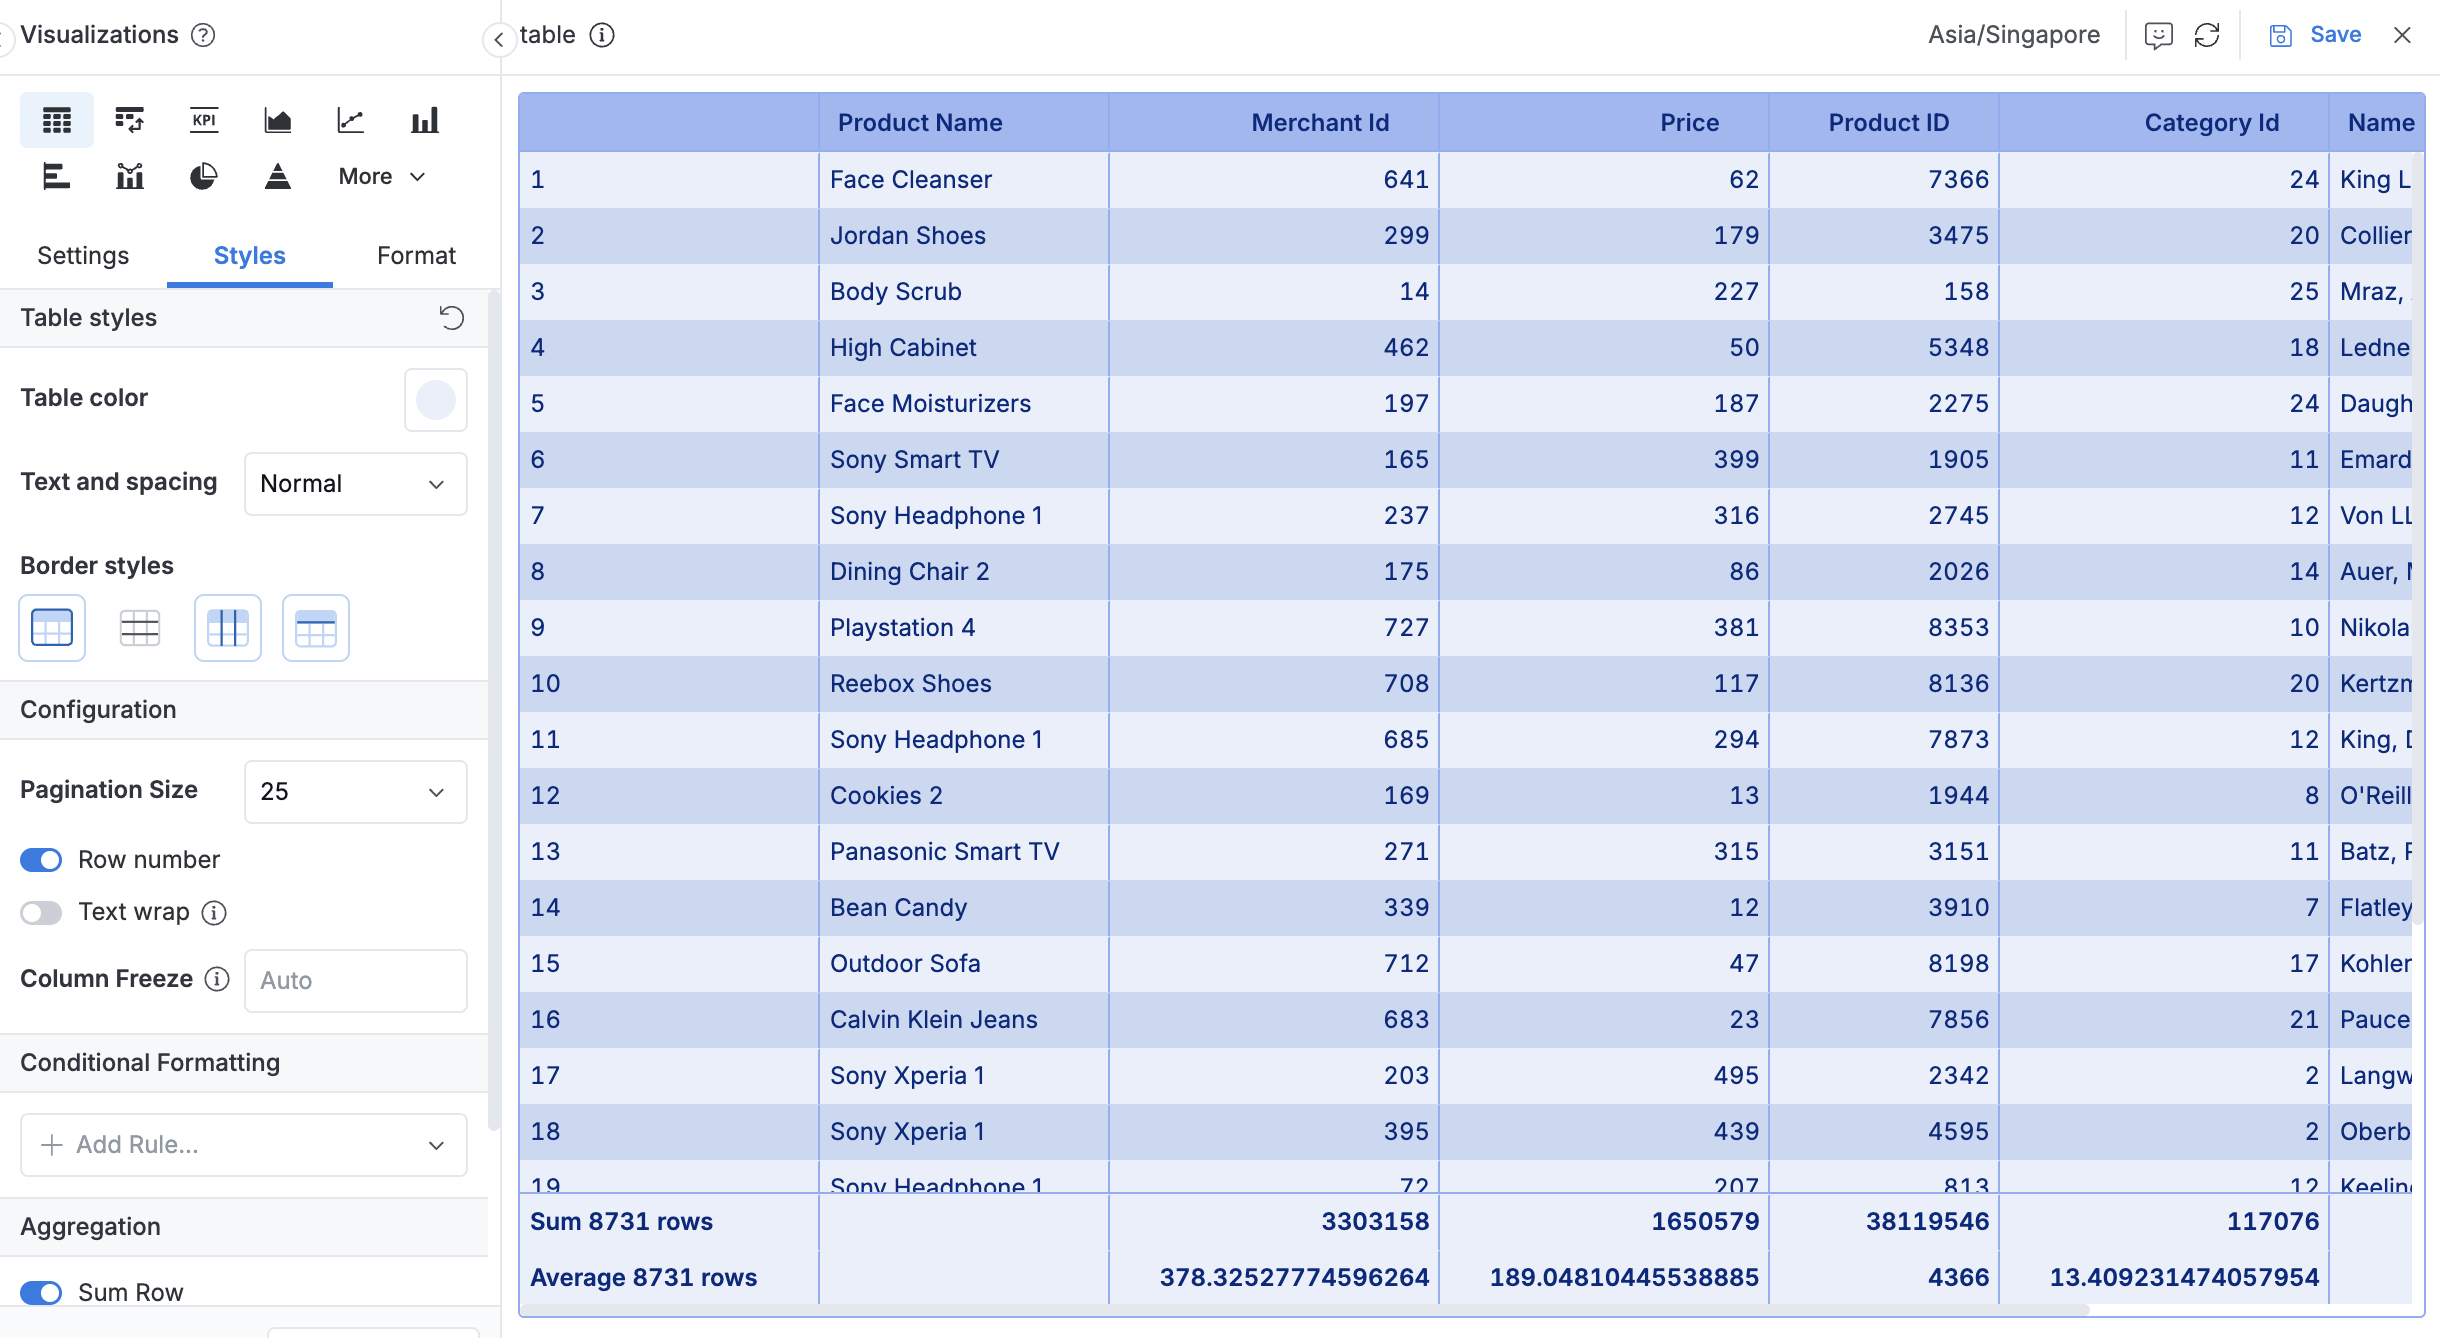
You can customize the appearance of your tables using these styling options:
- Table color: Select a color theme that automatically applies different shades to table components (headers, banding, body, font color, etc.)
- Text and spacing: Choose from three presets to control text size and cell padding:
- Compact: Smaller font size and reduced padding for dense data displays
- Normal: Balanced spacing and font size (default setting)
- Wide: Larger font size and increased padding for enhanced readability
- Border styles: Customize which borders to include or remove in your table.
Custom table styles applied here will override any table theme styles defined in your Dashboard Theme.
Configuration
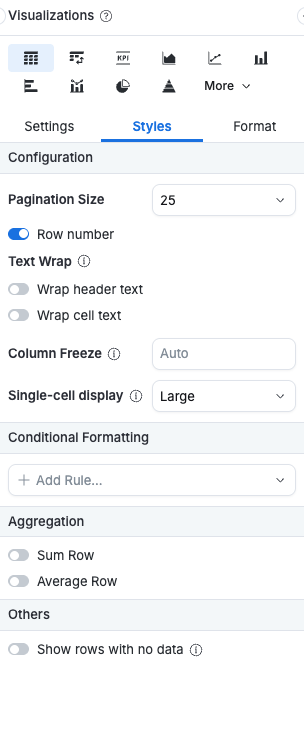
- Pagination Size: Define the number of rows displayed per page in the table.
- Row Number: Display the row number at the beginning of each table row.
- Text Wrap: Wrap text in long-content cell. For optimal performance, we recommend keeping these options disabled.
- Wrap header text: Wraps text in column headers.
- Wrap cell text: Wraps text in data cells.
- Column Freeze: Specify the number of columns to freeze from the left, including hidden columns, while excluding the Row Number column.
- Single-cell display: Choose how Holistics displays results that only contain a single cell. Select Large to show the value in a prominent, single-value layout, or Normal to keep the standard table layout.
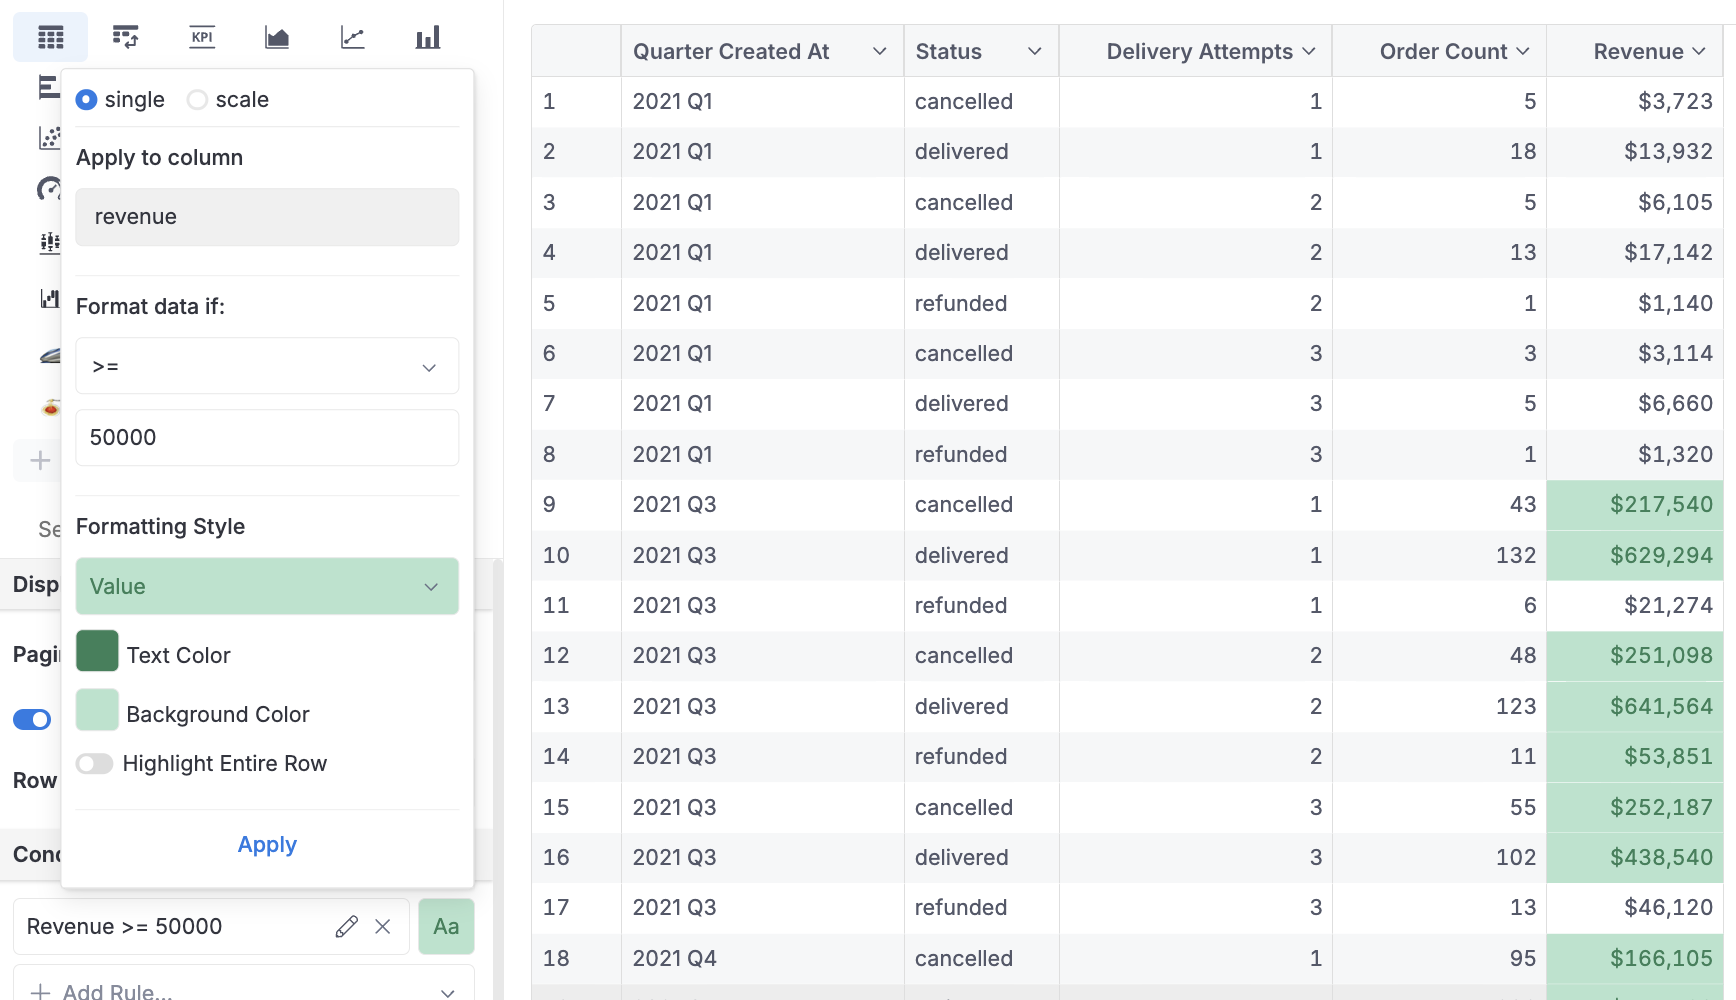
Conditional Formatting
Conditional Formatting helps you color table cells based on their values just like in Excel. There are two formatting modes:
Single Color Mode
Single Color Mode highlights only cells that satisfy a certain condition with the color you chose. This is useful when you want to single out some special values.
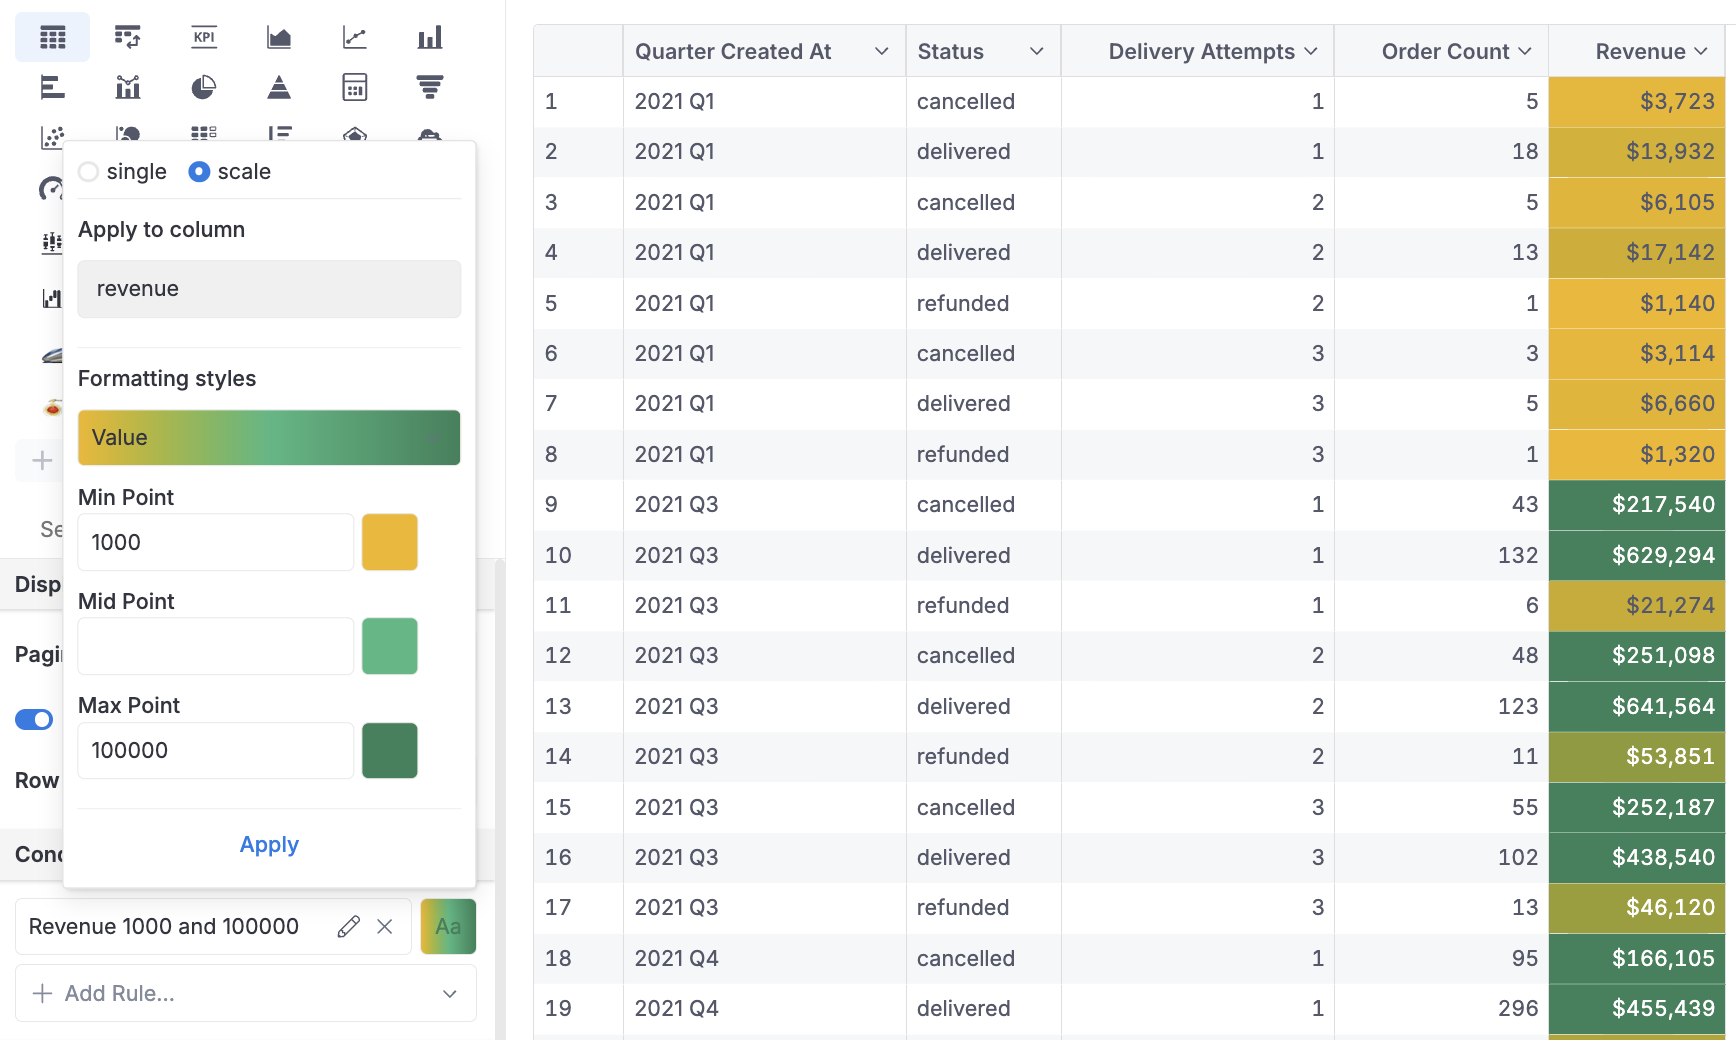
Color Scale Mode
With Color Scale Mode, you can color cells in a color gradient. The color will depend on the cell's value in your specified data range. Min and max points are required, and the midpoint is optional.
Aggregation
- Sum Row: Display a row with columns' sums
- Average Row: Display a row with columns' averages