Dataset
A grasp of these concepts will help you understand this documentation better:
Introduction
In Holistics, a Dataset is a "container" holding several data models together so they can be explored together, and dictating which join path to be used in a particular analytics use case.
In other words, Dataset is like a mini data mart that enables:
- Data Exploration: Dataset can be shared to Explorers (non-technical users) to do self-service exploration of the data.
- Creating Charts: All Charts in Holistics have to be created from a dataset.
Create a dataset
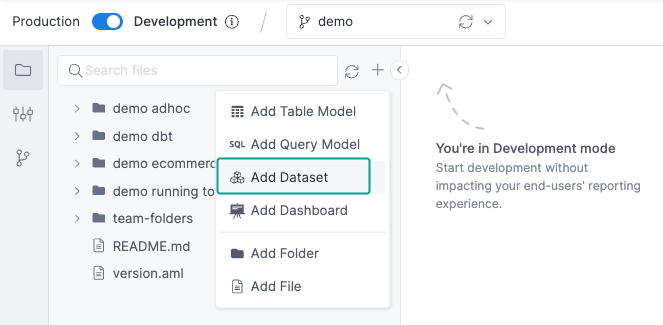
To create a new dataset, go to the Development, click on the + symbol next to a folder, and select Add Dataset.
A new screen will appear, and here you can add more details to your datasets and select models to be included.
After clicking Create Dataset, the new dataset will appear in your the folder tree as a file with the following format: my_dataset_name.dataset.aml.
Alternatively, you can also write the .dataset.aml file from scratch. In the next section, we will briefly go through the items in the dataset's code representation.
Dataset components
Please refer to AML Dataset Reference to learn more about all available parameters and their example usage.
In general, a dataset has the following components:
- Dataset metadata: dataset labels, descriptions, owners, and the data source that the dataset will query from.
- Data models included in the dataset.
- Relationships between the included models.
- Metrics for complex aggregations.
- Dimension for complex cross-model reporting use cases.
- Dataset Views for customizing the look of the dataset.
Putting together, a dataset definition has the following form:
Dataset definition
// demo_ecommerce.dataset.aml
Dataset simple_dataset {

  // Basic metadata
  label: '[Demo] Ecommerce'
  description: 'Demo dataset for E-commerce use cases test'
  owner: '[email protected]'
  data_source_name: 'demodb'

  // List of models in the dataset
  models: [
    orders,
    order_items,
    users,
    products,
    categories
  ]

  // Relationships between models
  relationships: [
    relationship(orders.user_id > users.id, true),
    relationship(order_items.order_id > orders.id, true),
    relationship(order_items.product_id > products.id, true),
    relationship(products.category_id > categories.id, true)
  ]

  // Metrics
  metric count_orders {
    label: 'Count Orders'
    type: 'number'
    definition: @aql orders.id | count() ;;
  }

  metric sum_order_value {
    label: 'Sum Order Values'
    type: 'number'
    definition: @aql order_items | sum(order_items.quantity * products.price) ;;
  }

  metric average_order_value {
    label: 'Average Order Value'
    type: 'number'
    definition: @aql sum_order_value / count_orders;;
  }

  // Dimension
  dimension acquisition_month_cohort {
    model: users
    type: 'date'
    label: 'Acquisition Month Cohort'
    definition: @aql min(orders.created_at | month()) | dimensionalize(users.id);;
  }

  // Dataset view definition
  view {
    model orders { }
    model users { }

    group relevant_models {
      model products { }
      model categories { }
    }

    group business_metrics {
      metric sum_order_value
      metric average_order_value
    }
  }
}
Interactions with dataset
Explore Dataset
Users can easily explore their data with the familiar drag-and-drop interface, and save the result as a widget in a dashboard.
You can also explore a report / dashboard widget's result by clicking on it and choose "Explore Data". For more details, please refer to Explore Data.
Share Dataset
Just like with your reports, dashboard or KPI metric sheets, you can share Datasets to specific users or groups. Sharing a folder will automatically share all items inside.
Best practices
For best practices on creating, organizing and optimizing performance of datasets, please refer to Best Practices.