April 14, 2026
🔧 Configure User Access to AI
new feature
Control who can use AI in your organization. This helps you roll out AI gradually and enable it for selected teams first.
Learn more: Holistics AI | User Access

Keep track of the latest features, improvements, and fixes in Holistics.
Follow every release on LinkedIn · X · Product newsletter.
Control who can use AI in your organization. This helps you roll out AI gradually and enable it for selected teams first.
Learn more: Holistics AI | User Access

Widget exports now reflect ad-hoc interactions you've applied on screen - so what you export is exactly what you see.
Previously, exporting a chart after applying ad-hoc changes would revert to the original unmodified data. To get an accurate export, users had to switch to Explore mode and manually reapply every interaction. Now the export captures the current on-screen state directly - no workaround needed.
This applies to all supported ad-hoc interactions on the widget:
Both data exports (CSV/Excel) and image exports (PNG/JPEG/SVG/PDF) are covered. No UI changes - same export action, correct output.
SCIM provisioning and SSO enforcement are now available on the Custom Plan. Your Identity Provider (Okta or Microsoft Entra ID) can be the single source of truth for who has access to Holistics.
Previously, every user account and group had to be created and maintained manually inside Holistics, separate from your IdP. At enterprise scale, this meant manual invites for every new hire, manual deactivations on offboarding, and constant drift between IdP groups and Holistics groups. Now, your IdP pushes user and group changes to Holistics automatically: users are created on assignment, profiles update on change, and accounts deactivate on removal.
Learn more: SSO & SCIM Provisioning
AI Chat History is now available. Holistics saves every conversation automatically, so you can pick up where you left off — whether you closed your browser, switched tabs, or came back the next day.
Previously, you lost AI conversations the moment you navigated away or refreshed the page. Now your full conversation history — questions, answers, and generated charts — persists across sessions.
Learn more: AI Chat History
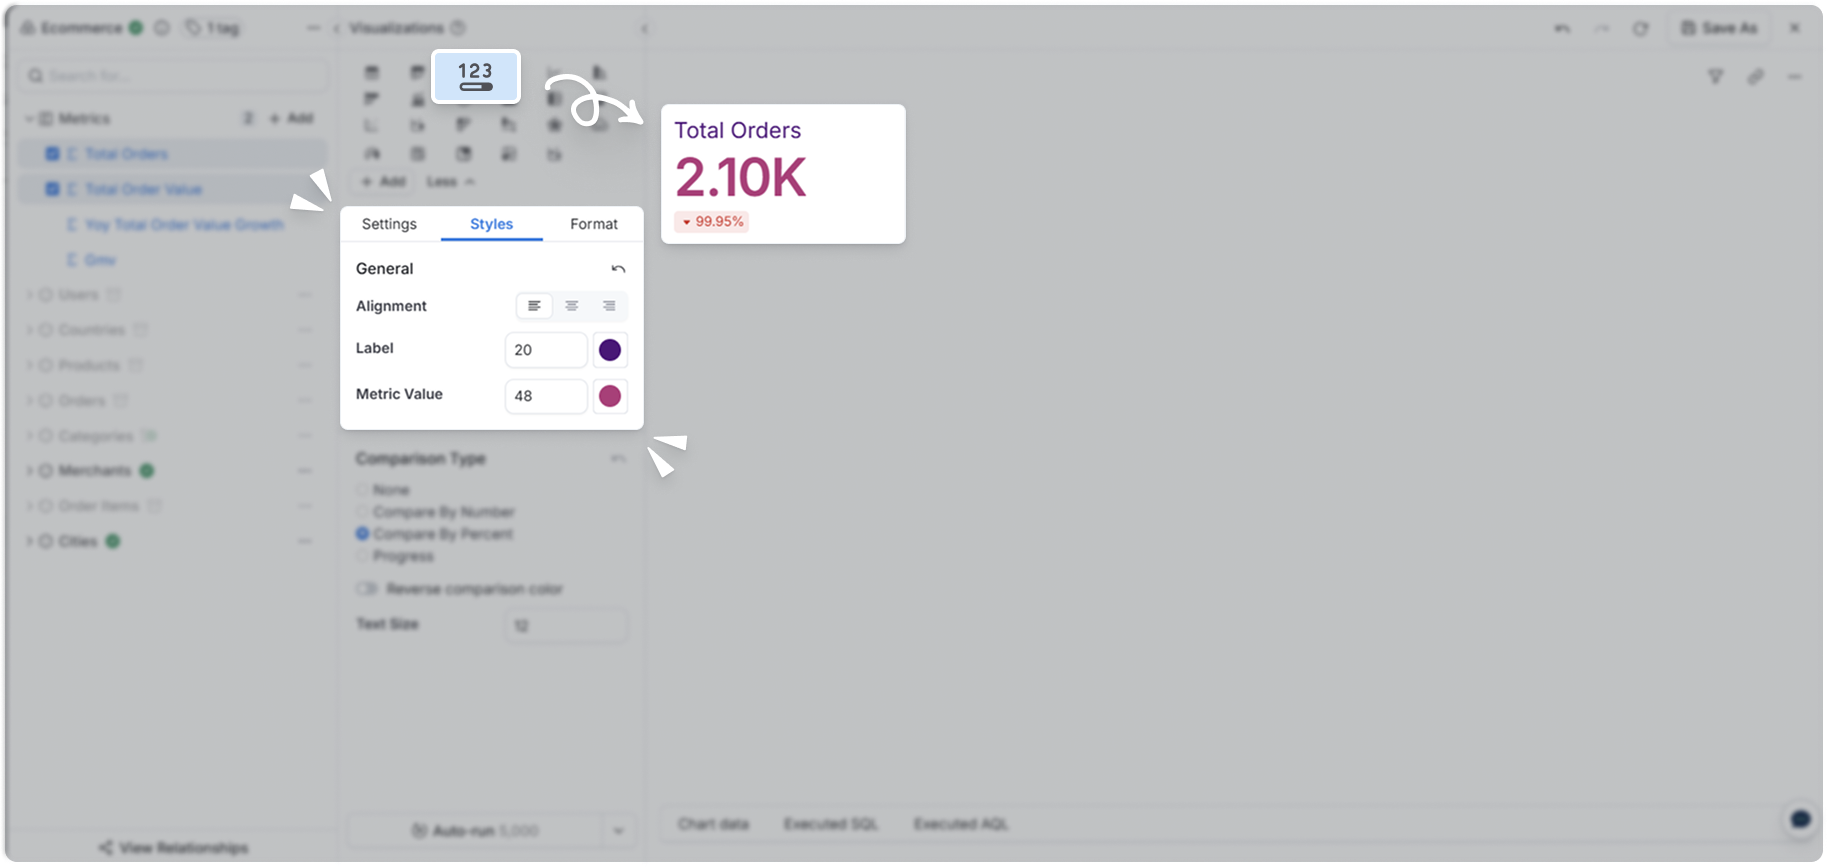
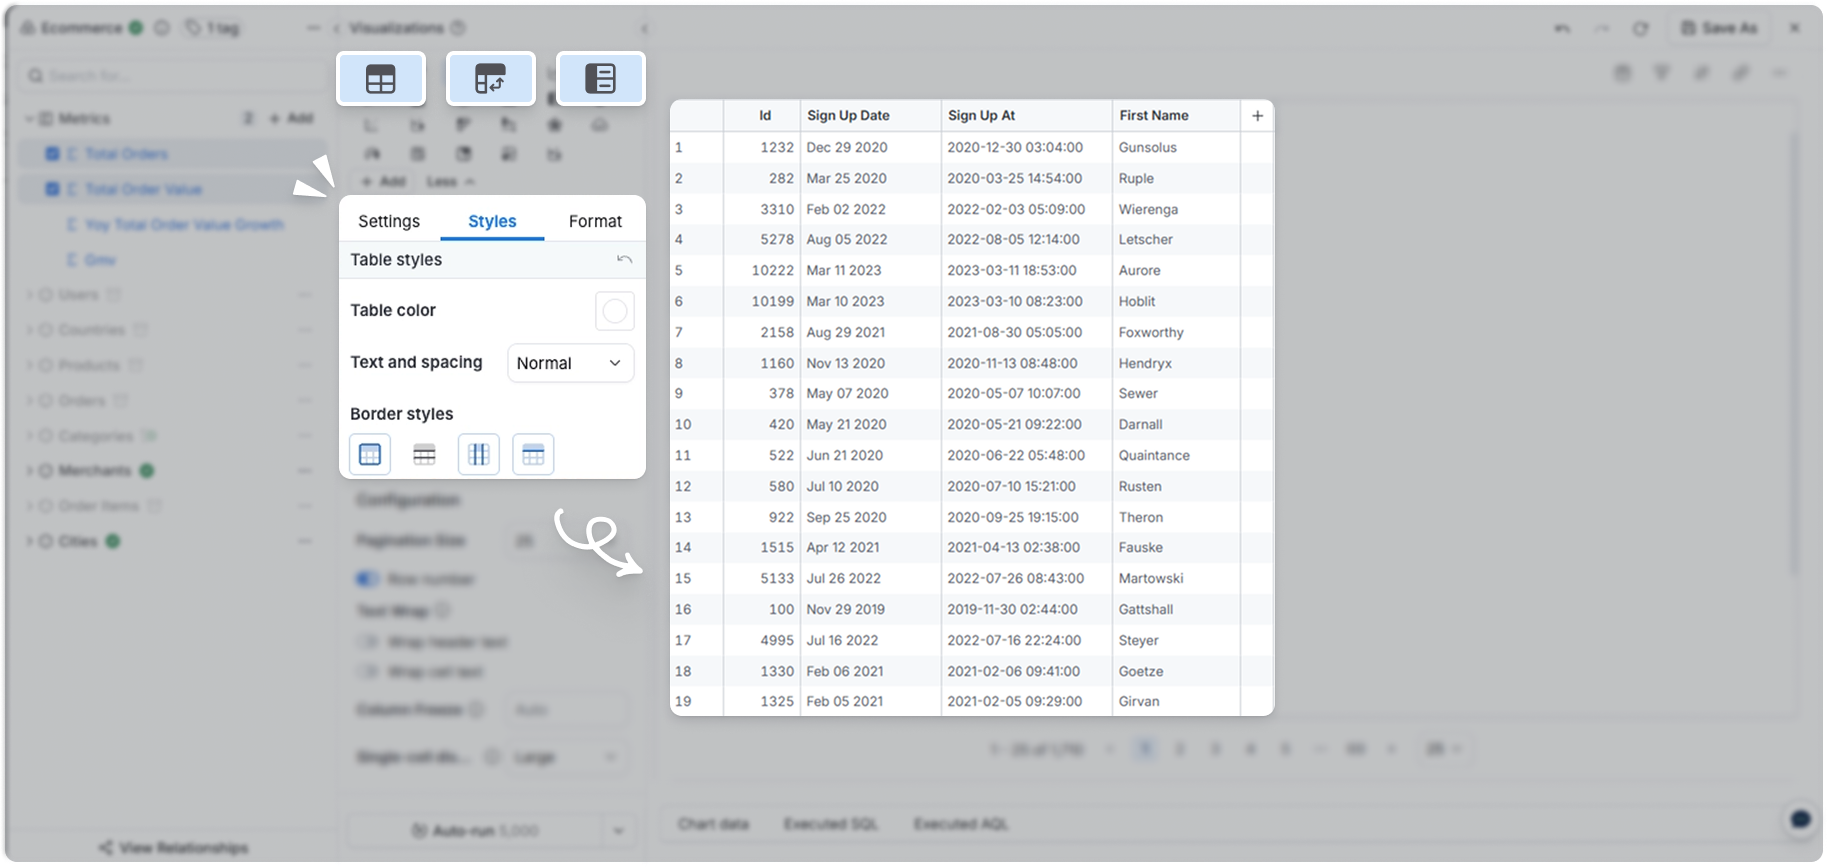
Chart styling is now available in Reporting — configure styles for KPI Metric, Data Table, Pivot Table, and Metric Sheet directly from Dataset Explore and the Report creation flow, no need to switch to Development.
Previously, chart styling was only accessible in Development or the canvas dashboard editor. This added friction and blocked explorers entirely. Now you can do it right in Reporting.
Learn more: KPI Metric · Data Table · Pivot Table · Metric Sheet

We've redesigned the Explore settings panel with an improved visual hierarchy, making it easier to configure your visualizations.
Previously, the settings panel used older styling that made it harder to scan and find the options you needed. Now you get clearer spacing, better typography, and enhanced contrast - all aligned with the Holistics UI refresh from December 2025.
This is part of our ongoing Explore interface improvements. Soon, you can expect a whole new layout with a redesigned chart picker and collapsible configuration panel.
Learn more: Explore Interface Enhancement

Theme Builder Sandbox is now available as a standalone tool to design dashboard themes visually.
Previously, creating a theme required writing AML code by hand — a tedious process with no way to preview changes in real time. Now you can use the sandbox to design interactively, see your changes instantly, and export the generated AML code to use in Holistics.
How it works:
Learn more: Dashboard Themes
Drill-through now respects "any value" filter states from the source dashboard when navigating to a target dashboard.
Previously, drill-through ignored filters set to "any value" (show all) — the target dashboard applied its own defaults, producing unexpectedly narrowed results. Now, "any value" selections carry through as intended, so your target dashboard shows the full dataset you expect.
Learn more: Drill-through

Dashboard themes configuration is now available in Reporting. Select and apply themes directly when building canvas dashboards — no need to switch to Development.
Previously, configuring themes required switching to Development, which added friction and blocked explorers entirely. Now you can do it right in Reporting.
Learn more: Dashboard themes
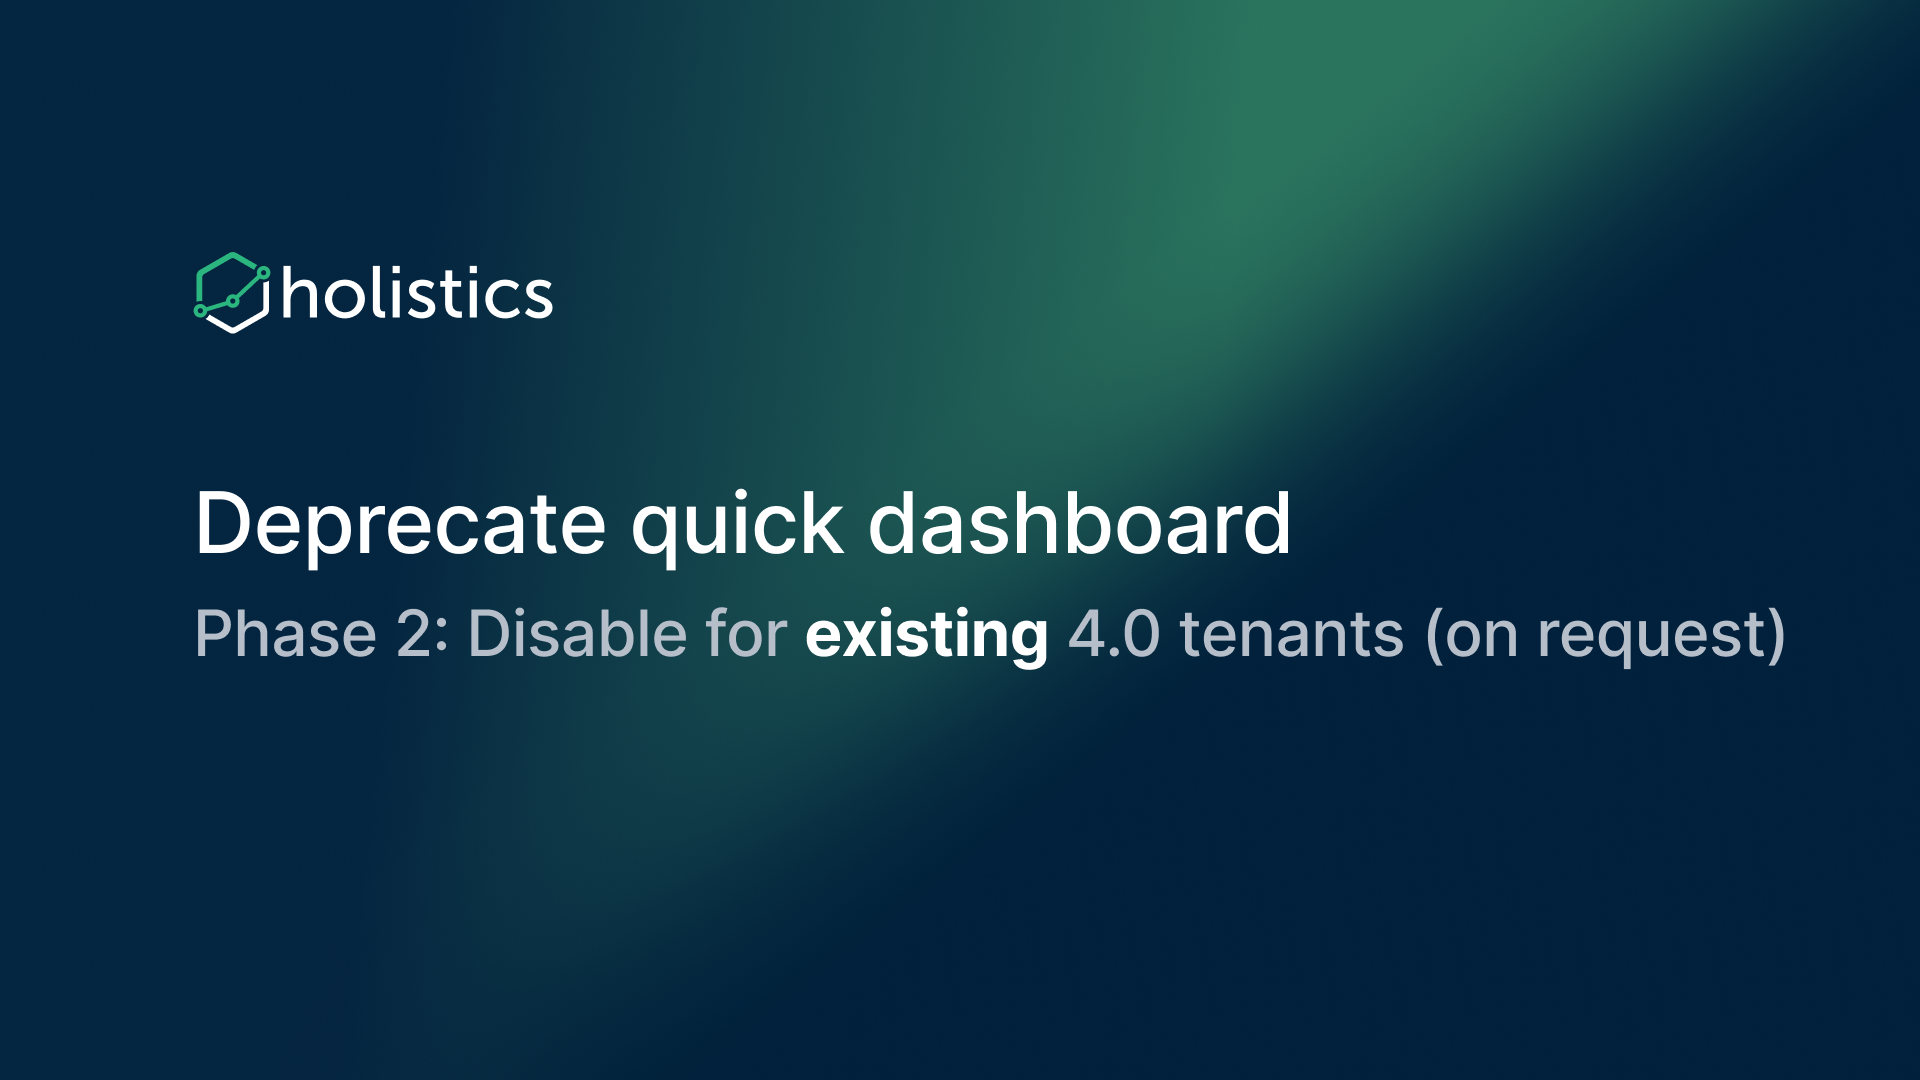
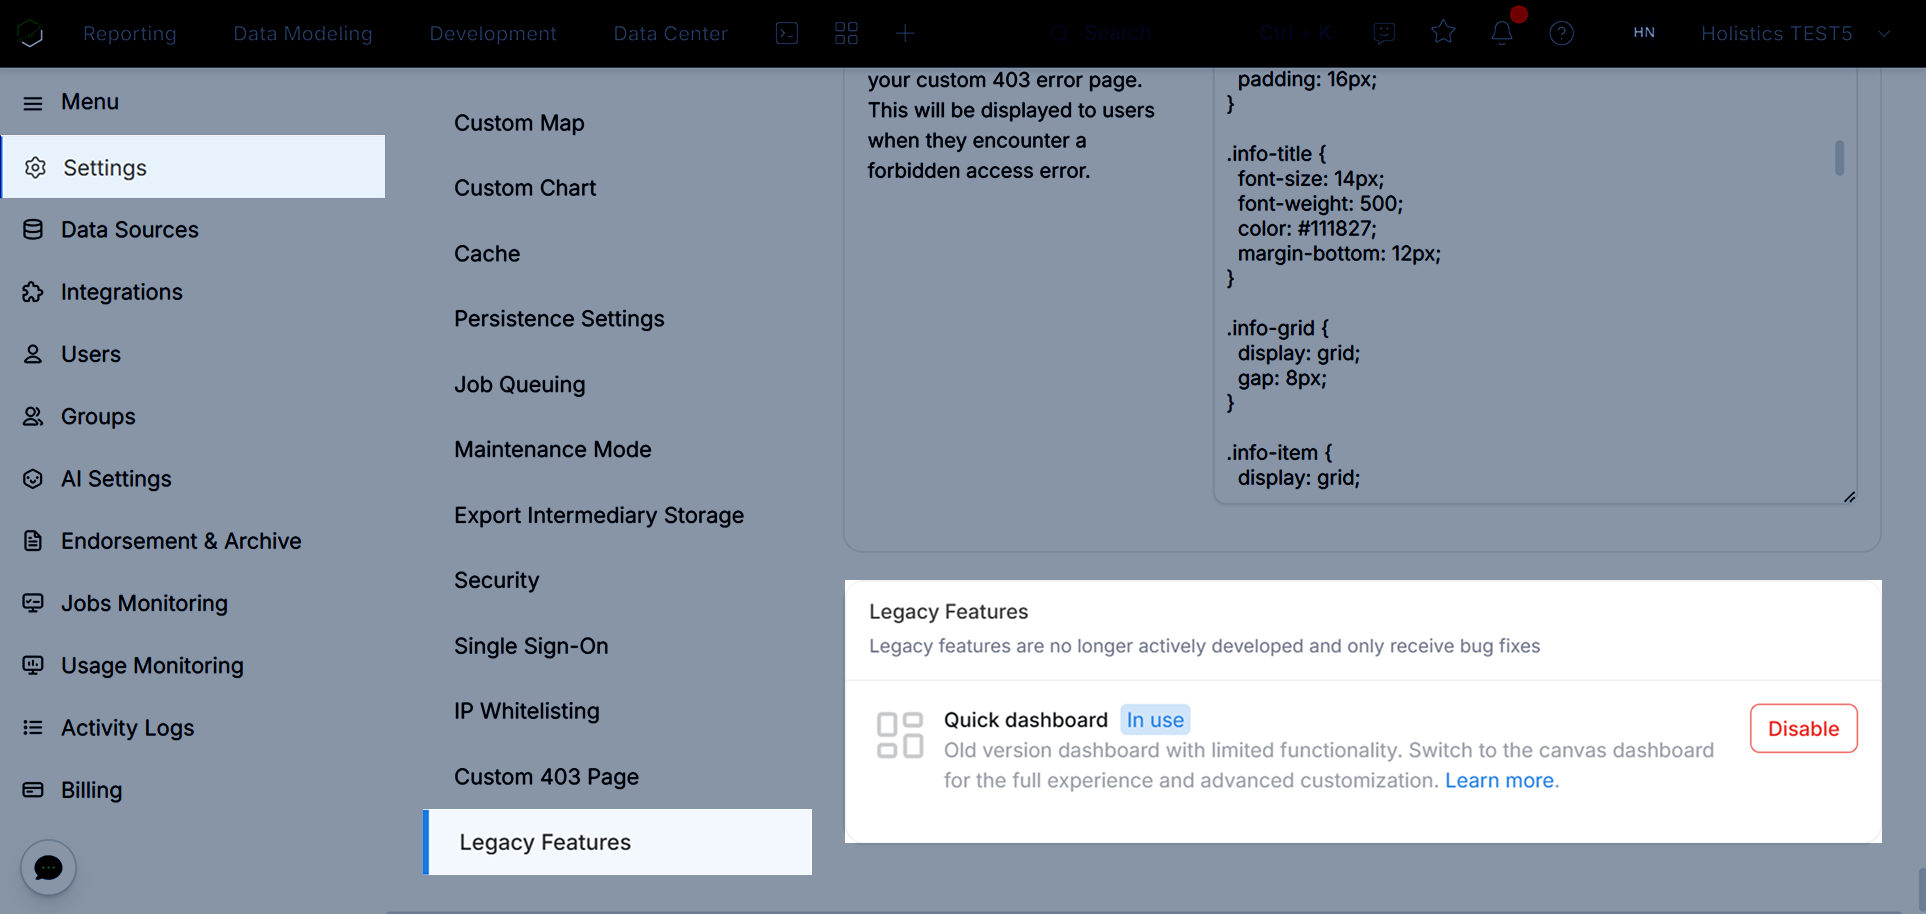
We're announcing the official plan for deprecating the quick dashboard for existing 4.0 tenants (via Administration settings).
You can now choose between two paths:
If you choose to deprecate the quick dashboard: