Drill-through
A grasp of these concepts will help you understand this documentation better:
Introduction
In Holistics, Drill-through allows viewers to explore additional data related to one or more data in the original report.
For example, when looking at the total revenue of the Body Category in the United States, we want to see which cities are contributing to the revenue. We also want to know the customer demographics responsible for this revenue. With drill-through, viewers can easily click through and explore this detailed data.
Mechanism
In Holistics, drill-through is the process of linking many source dashboard [S] to one target dashboard [T] that contains information relevant to all the sources.
- Source dashboard: the dashboard that contains the generic data that we want to explore further. In our example, the
Category analysisdashboard is the source dashboard, the generic data is the revenue of New York. - Target dashboard: the dashboard that contains more specific information that provides us with a more detailed understanding. In our example, the
Customer Demographicsdashboard is the target dashboard, the customer emails, age groups, and gender distribution are detailed information.
Technically, we are creating a filter (Filter X, Y, Z) at the target dashboard that can take the value of any field (field_a, field_b) from any dataset (DSa, DSb)
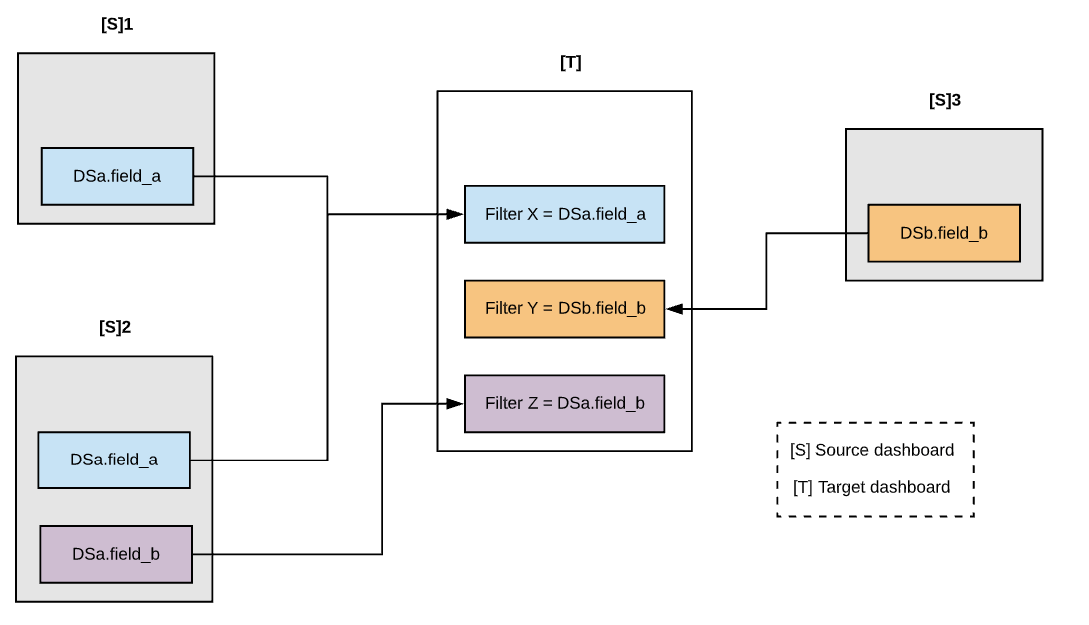
Then, whenever we want to drill through from any source dashboard (that contains those fields), we will be navigated to the target dashboard where that field's value is applied as a filter (Filter X = DSa.field_a, Filter Y = DSb.field_b, Filter Z = DSa.field_b)
For example:
- We create a filter of Category Name and City Name at the target dashboard
Customer Demographicso that they can take the value of T-Shirts (as category) and New York (as city). - When we click on the revenue column of T-shirts in New York from
Category Analysis, we will navigate to the dashboard that contains customer demographics and information that buys T-shirts in New York.

How it works
Set up drill-through at the target dashboard(s)
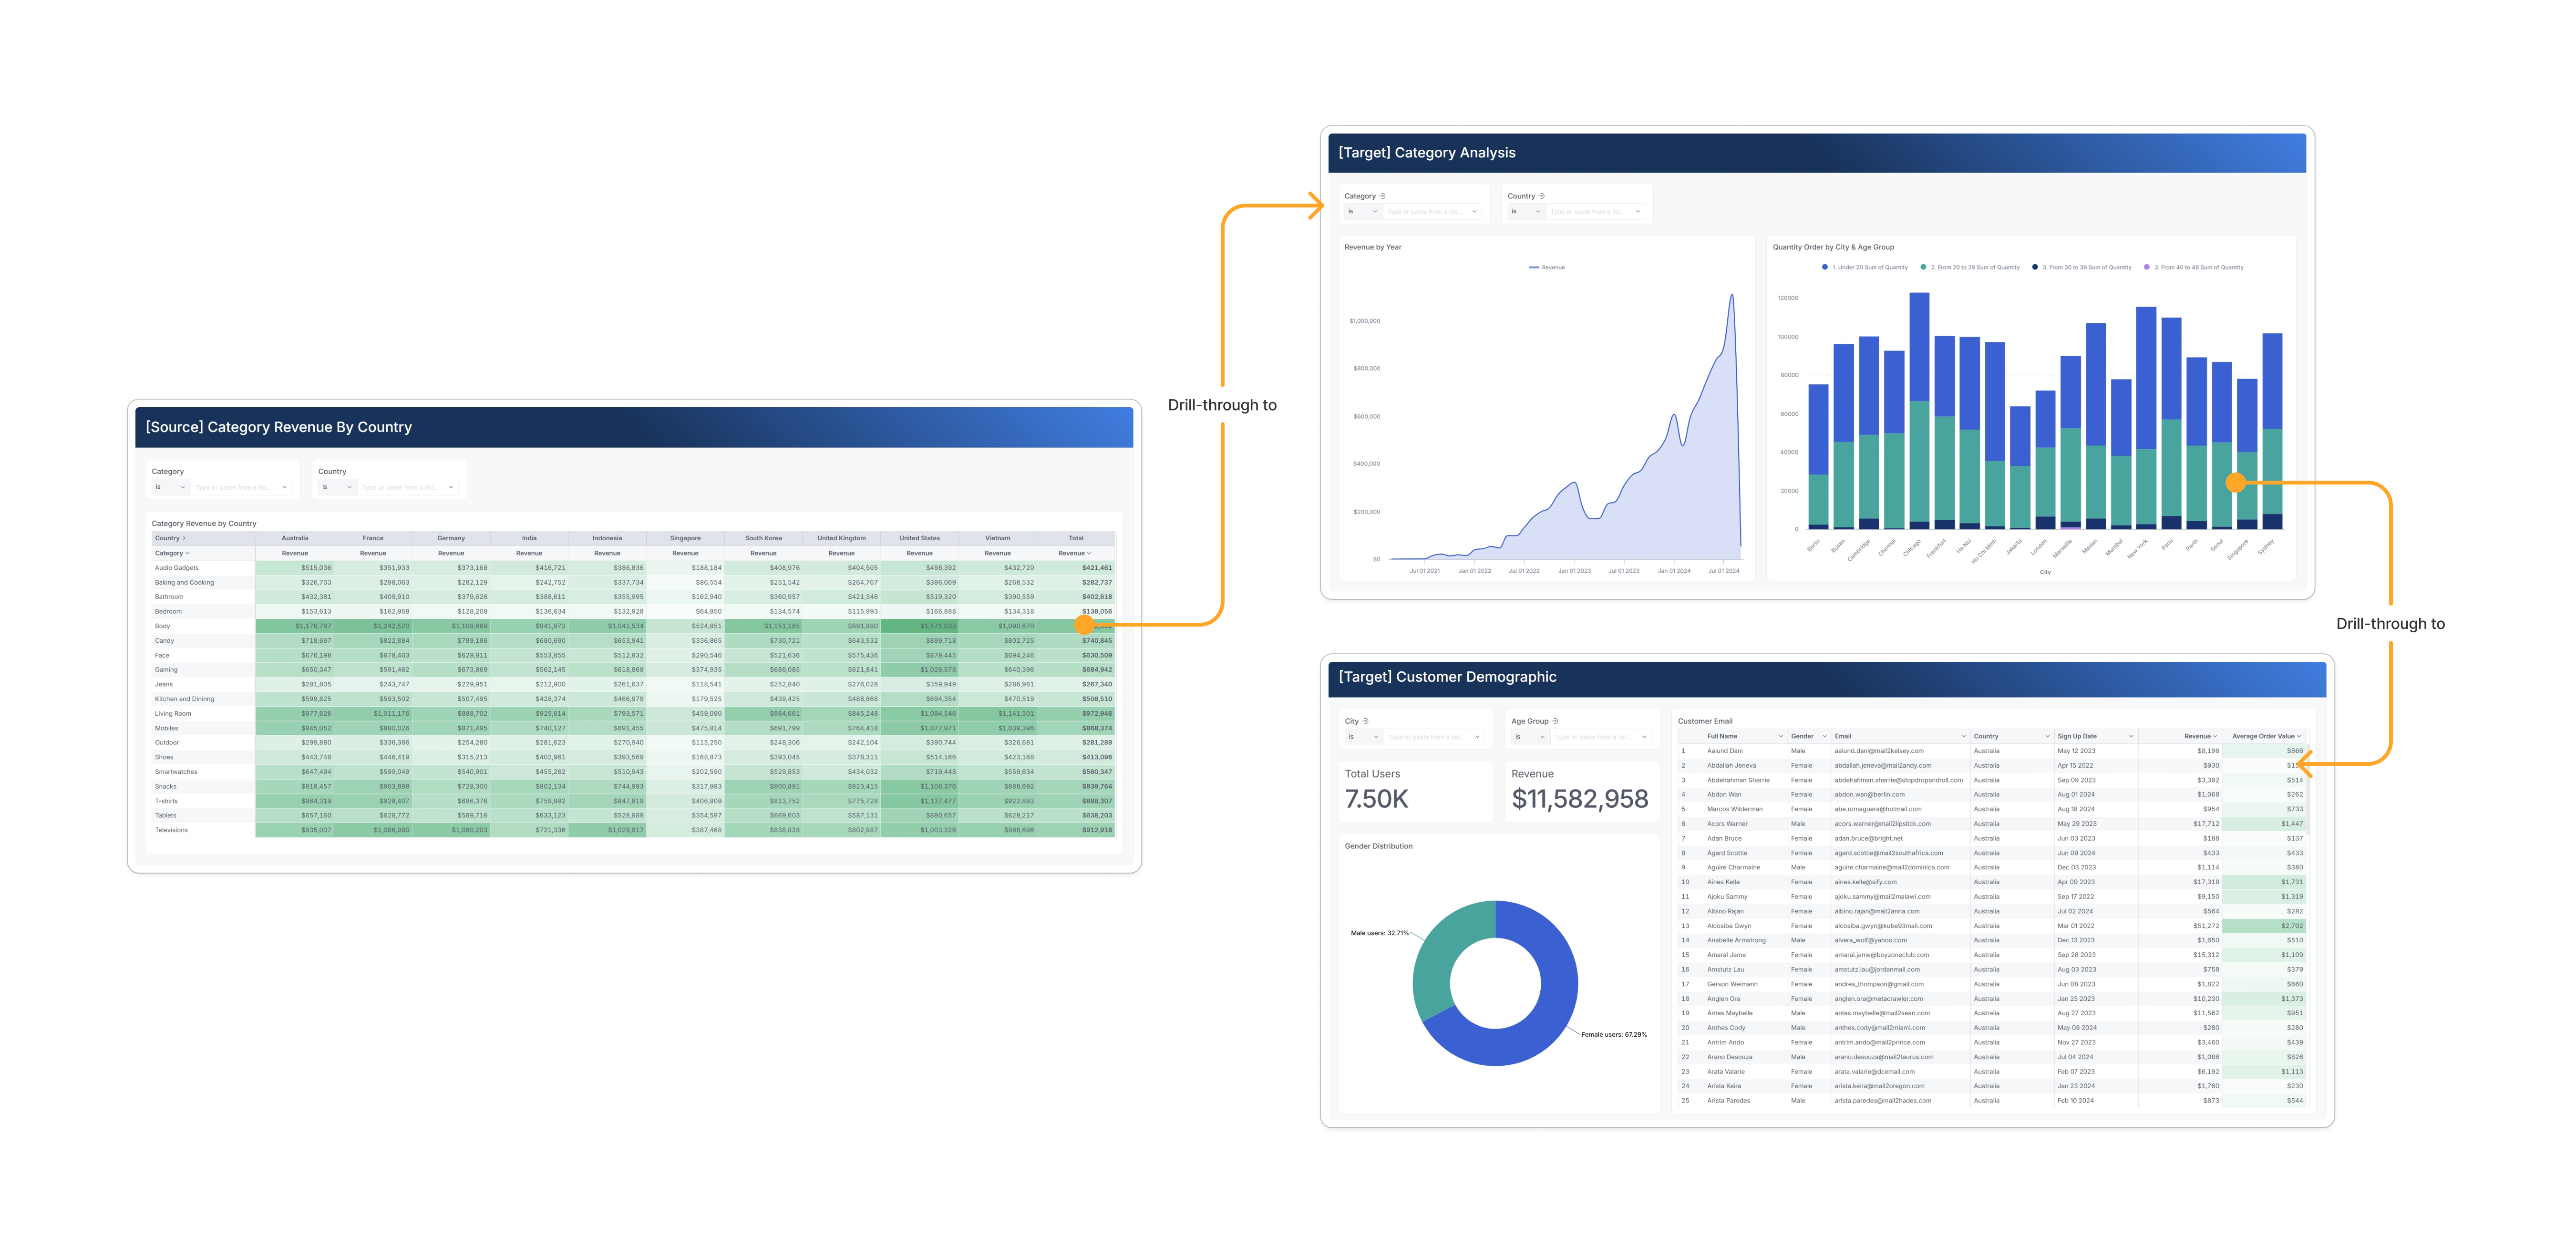
Before setting up drill-through, you should determine the source and target dashboards. In this example, we have the following dashboards:
- Source dashboard:
Category Revenue by Country - Target dashboards:
Category AnalysisCustomer Demographic
Step 1: Create Filters at target dashboards
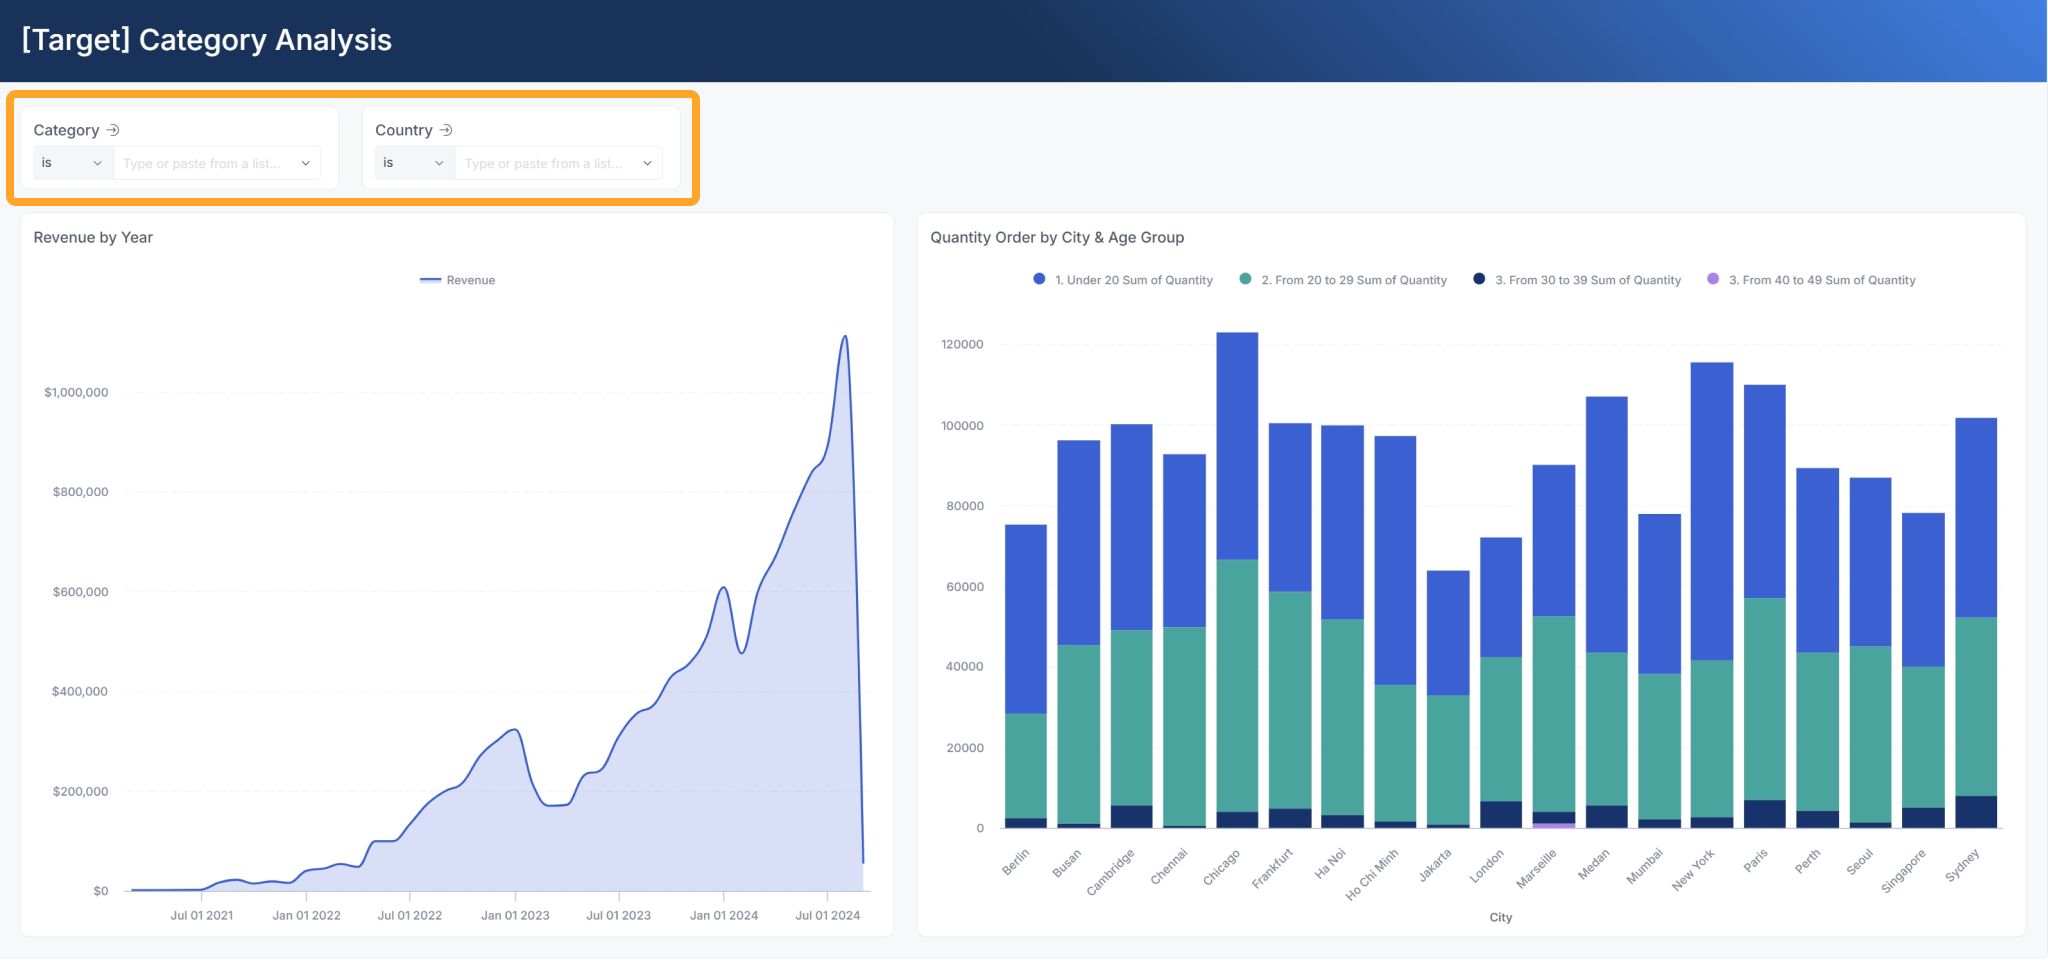
On the target dashboard Category Analysis, create Category and Country filters and select all the visualizations you want to apply the filters to.
By doing this, when you drill-through from the source dashboard Category Revenue by Country, you will be able to navigate to Category Analysis dashboard with filters Category = Body and Country = United States applied.
Step 2: Enable Drill-through in Filters
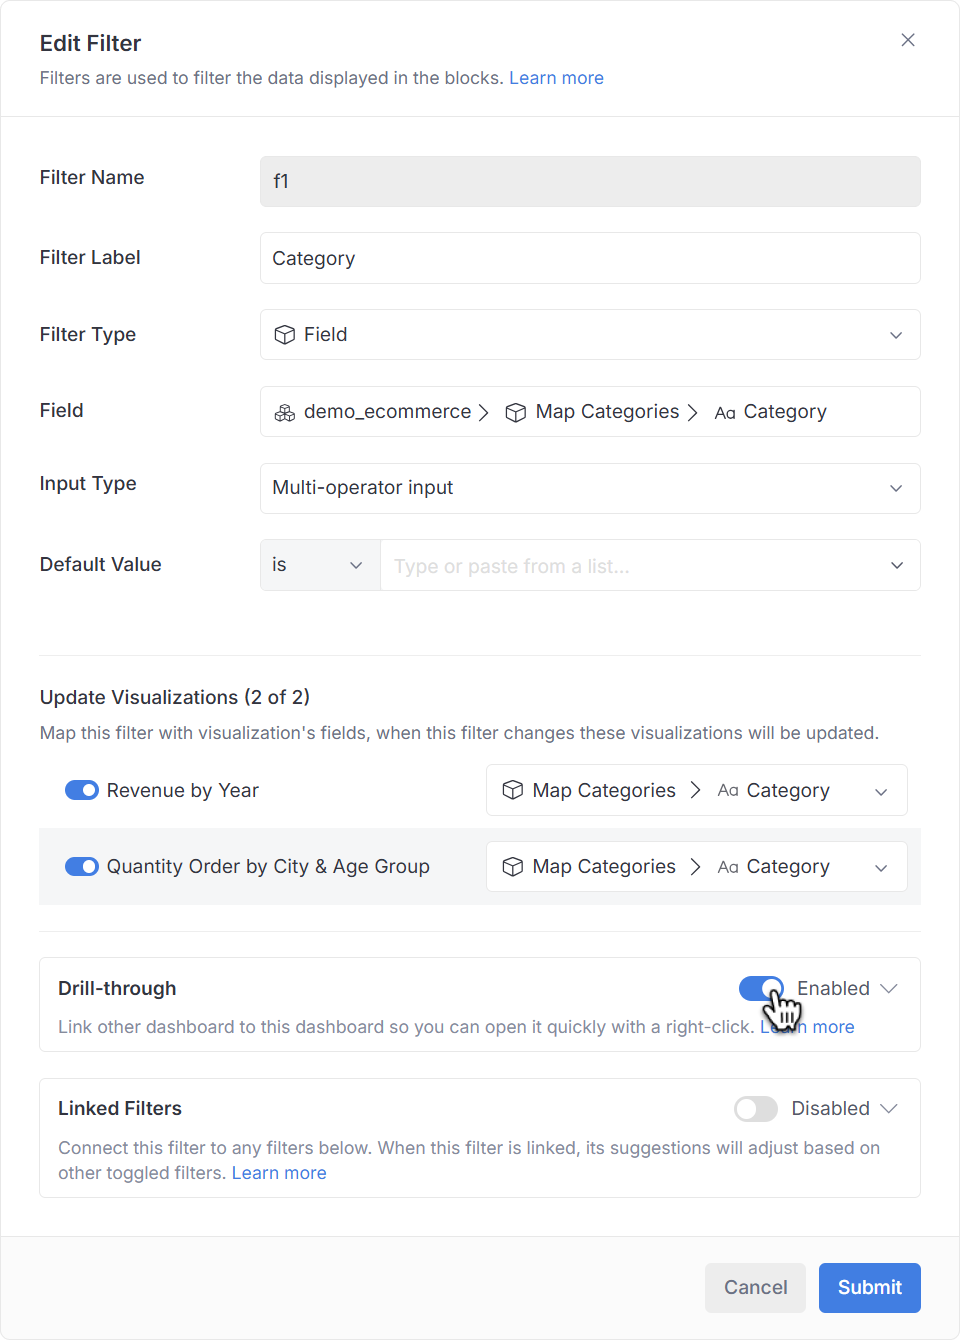
To enable Drill-through, simply toggle on Drill-through option in your Filters. After completing this step, you can start drilling-through from any visualizations in any dashboard that contain the field Category. You can customize this behavior with advanced configurations.
Use drill-through from the source dashboard
After setting up Drill-through at target dashboards, you can drill-through from the source dashboard by right-clicking on the data points.
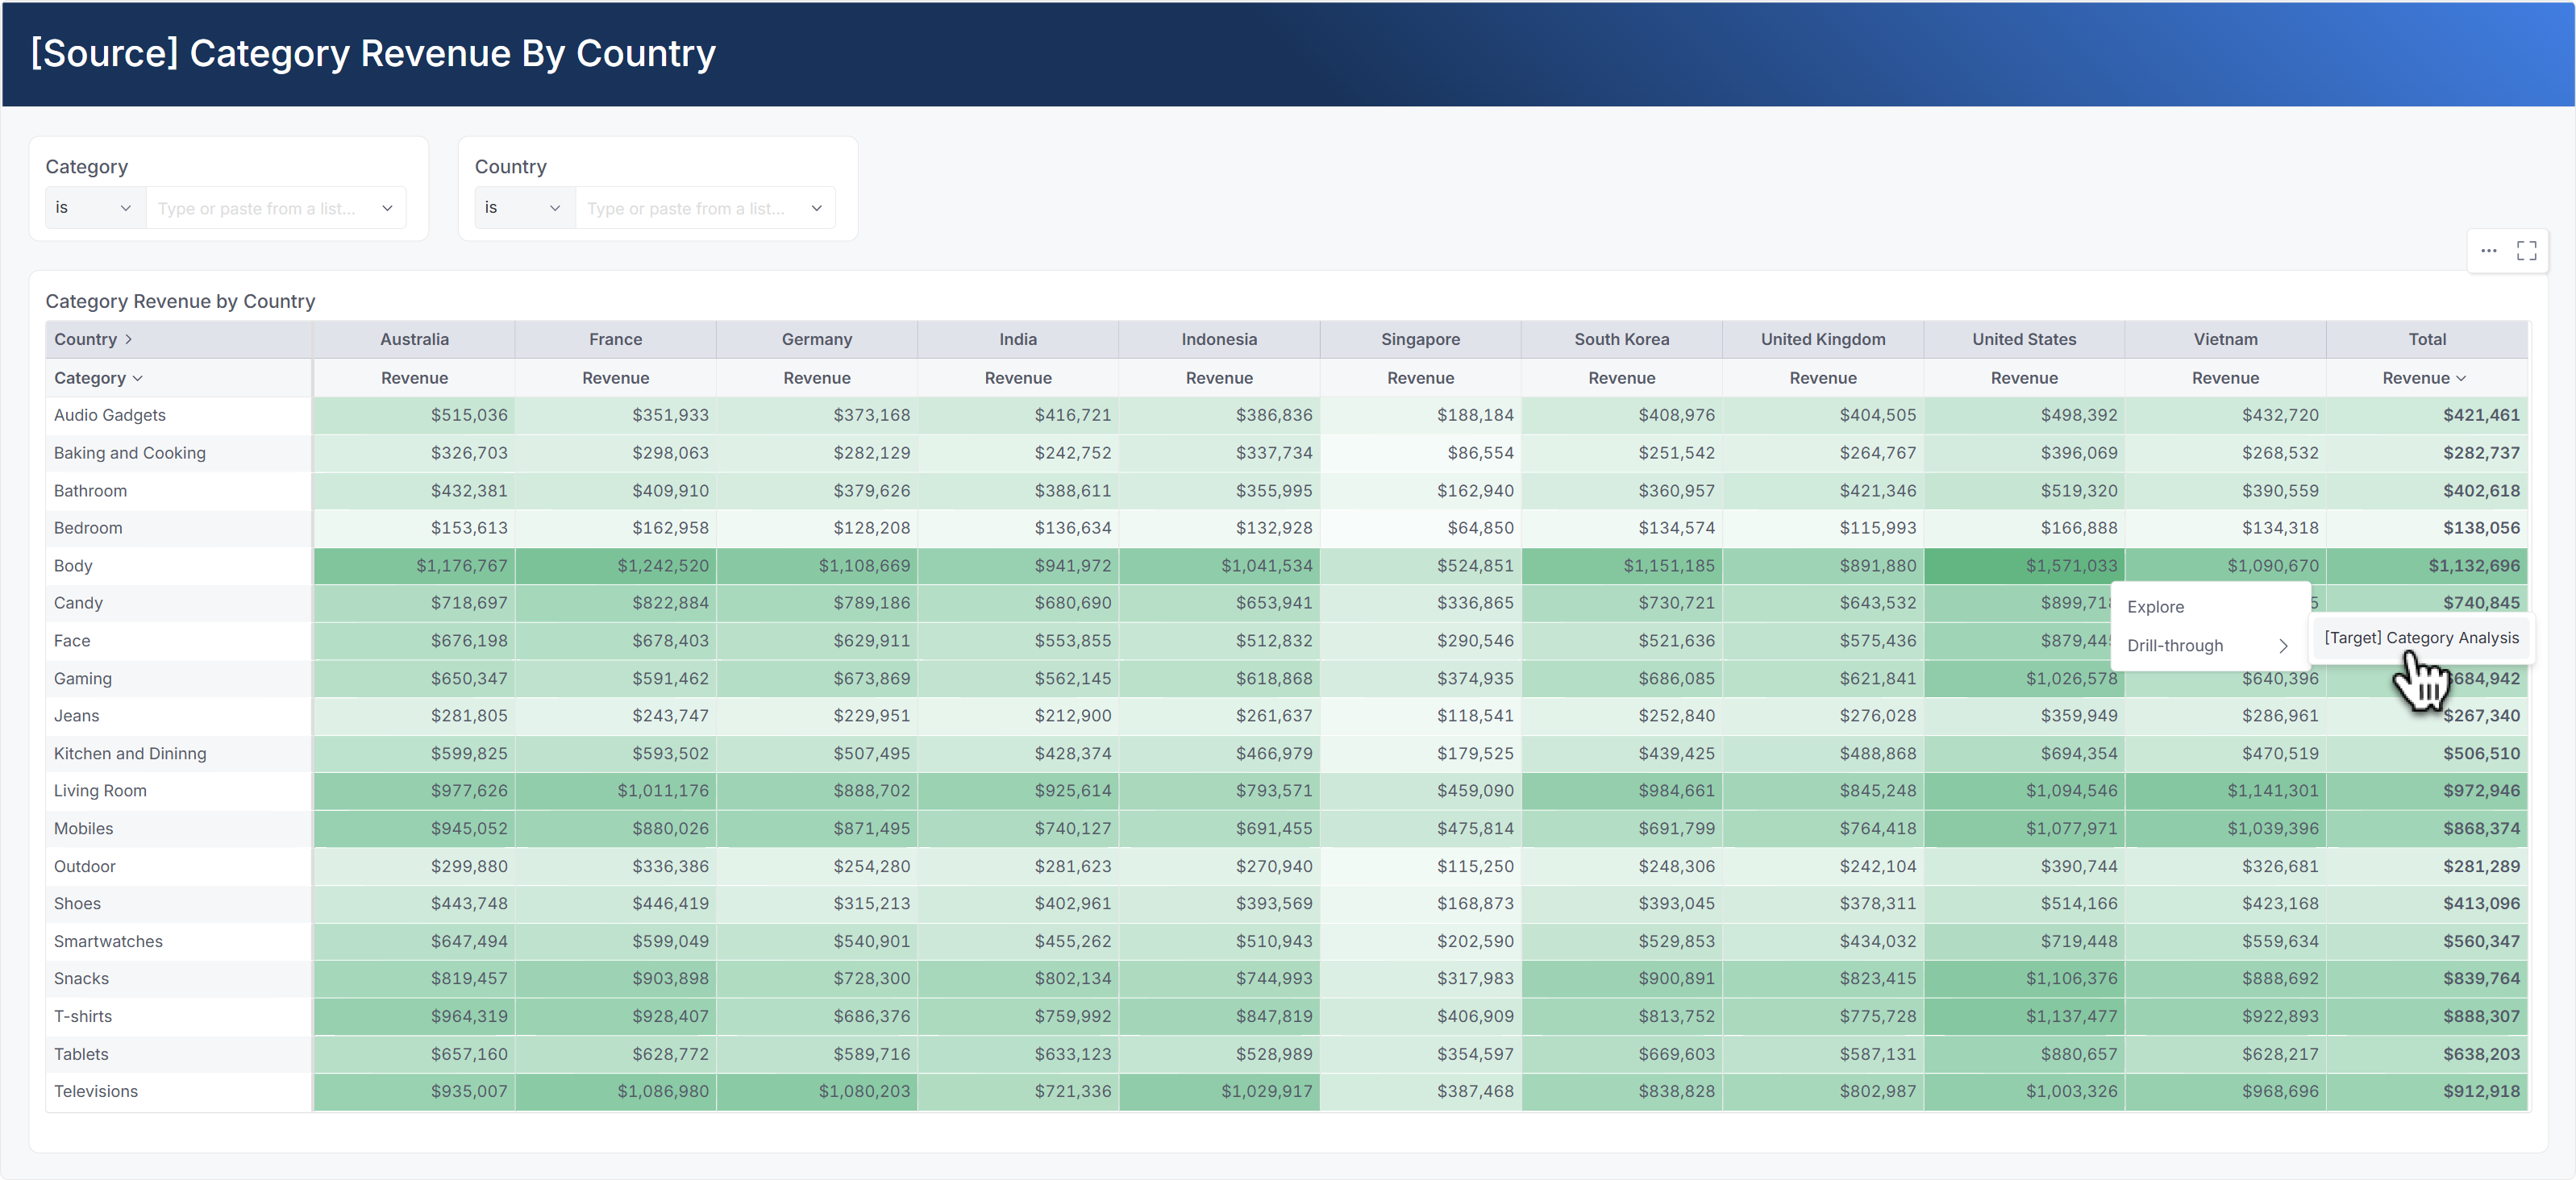
For example, when right-clicking on the Revenue of Body Category in the United States, the values Category = Body and Country = United States are passed as filter values on the target dashboard Category Analysis. Similarly, when right-clicking on the the Quantity Order in Chicago by users aging from 20 to 29, the values City = Chicago and Age Group = From 20 to 29 are passed as filter values on the target dashboard Customer Demographic.
When you set up drill-through filters at the target dashboard, you can drill from any source dashboards, as long as the source and the target dashboards containing reports that are created from the same dataset.
After navigating to the target dashboard, viewers can continue to drill-through to another target dashboard (if any) or explore the current data.
- If viewers drill-through to another target dashboard, use the left/right arrow icon on the top right to go back and forth between dashboards.
- In addition, viewers can share, download, or go to the main dashboard view to edit it by clicking on the options on the top-right corner.
Advanced Drill-through configurations
The following configurations are only available in Canvas Dashboard. Auto mode is only available to Field Filters.
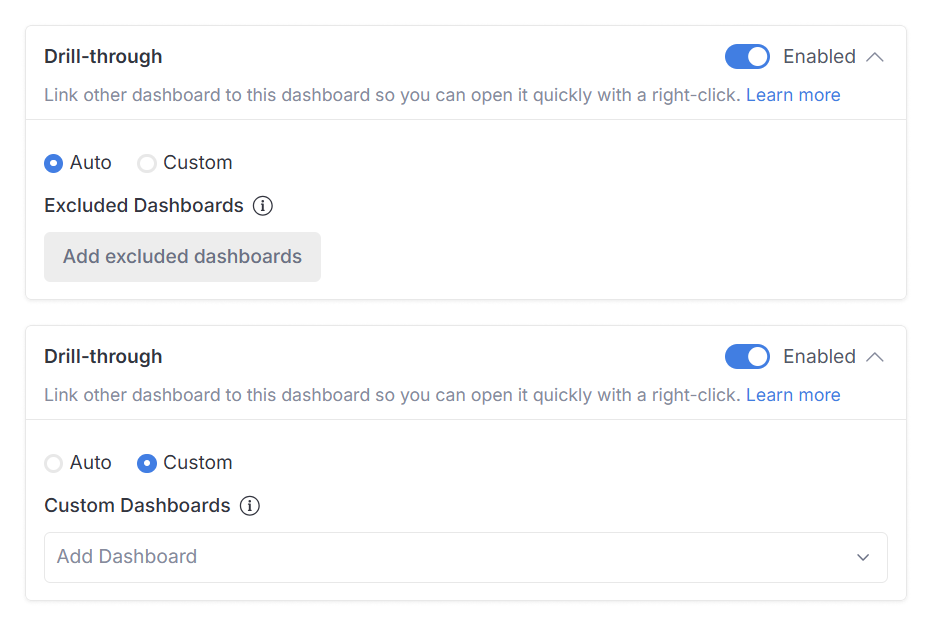
By default, Holistics automatically links all source dashboards containing widgets from the same dataset as filters on the target dashboards. To further customize this behavior, you have the following options:
Auto (default)
- Automatically links all source dashboards containing widgets from the same dataset as filters on the target dashboards.
- Provides a quick setup with minimal configuration.
- Disabled dashboard option: You can exclude specific dashboards from drill-through even if they contain relevant widgets. This is useful for dashboards that might technically qualify but aren't contextually relevant.
Custom
- Allows you to manually specify which dashboards should be linked to target dashboards.
- Holistics will only link the custom dashboards you select to target dashboards.
- Gives you precise control over drill-through behavior.
Supported visualization types
The following visualization types are supported for drill-through:
- Table
- Pivot Table
- Line chart family: Line/Bar/Column/Area/Combination chart
- Pie chart family: Pie/Funnel/Pyramid chart
- Scatter chart family: Scatter/Bubble chart
- Custom charts (with proper setup following this guide)
All other charts are not supported.