Filter Data
Holistics supports filtering, allowing you to narrow down results by time, customer segment, product category, or any other dimension. This helps you focus on exactly what matters. without rebuilding your dashboards.
With Holistics filters, you can:
- Filter a single visualization without affecting others
- Filter multiple visualizations at once
- Track which filters are active on your dashboard
- Share dashboard with prefilled filters
Filtering is performed on the original data values, not the formatted values. For example, when you format a number as a day of the week (1 → Monday), the filter input would be 1 instead of Monday.
Filter a single visualization
Use local conditions to filter individual visualizations without affecting the rest of your dashboard. These temporary filters are ideal for drilling into specific data points during exploration.
You can apply local conditions through right-click actions for quick filtering or the visualization toolbar for more control. Here's what you can accomplish:
Focus on specific segments
Remove outliers that skew your analysis with exclude, or spotlight specific segments with include. Perfect for removing noise from your data or zeroing in on specific regions, time periods, or categories.
How to apply: Right-click on x-axis labels, legend items with dimension values, or table rows to include or exclude those values.
Identify top and bottom performers
Instantly surface your best or worst performing segments without manual sorting. Perfect for identifying leaders and laggards in sales, customer segments, or any ranked metric.
How to apply: Right-click on legend items that display metric names or table column headers to apply Top N or Bottom N filters.
Filter by value
Find all values above or below a specific threshold. Useful for spotting anomalies, identifying high performers, or filtering data that meets certain criteria.
How to apply: Right-click on any data point or table cell value to filter using greater than (>), less than (<), or other comparisons.
Access more filtering options
When you need multiple conditions or want to see all available filter options, use the visualization toolbar for full control over your filtering criteria.
How to apply: Hover over any visualization and click the filter icon in the toolbar to access all filtering options and combine multiple conditions.
How local conditions work
-
Filters work on fields not displayed in the visualization - Local conditions work even when the filtered field isn't displayed in the visualization. For example, filter by customer segment without showing the segment column in your revenue table.
-
Local conditions are temporary and reset when the page refreshes. They're ideal for quick, exploratory analysis without permanently changing your dashboard view.
Filter multiple visualizations at once
Dashboard filters apply the same filter across multiple visualizations simultaneously, helping you analyze your entire dashboard through a consistent lens.
How dashboard filters work
-
Filters work on fields not displayed in the visualization - Dashboard filters work even when the filtered field isn't displayed in the visualization. For example, filter by customer segment without showing the segment column in your revenue table.
-
Filters can be scoped - Dashboard filter can be configured to affect all visualization blocks on the dashboard, or limit them to specific visualizations only (see Setup dashboard filter).
-
Local condition combine with dashboard filters - When both exist, they use AND logic, meaning both conditions must be met for data to be rendered.
Track and manage filters across dashboard
When working with dashboards containing a large number of visualizations and filter mappings, understanding which filters affect which visualizations can become challenging (especially as you navigate between tabs).
The controls & filters panel provides a centralized view to help you manage this complexity.
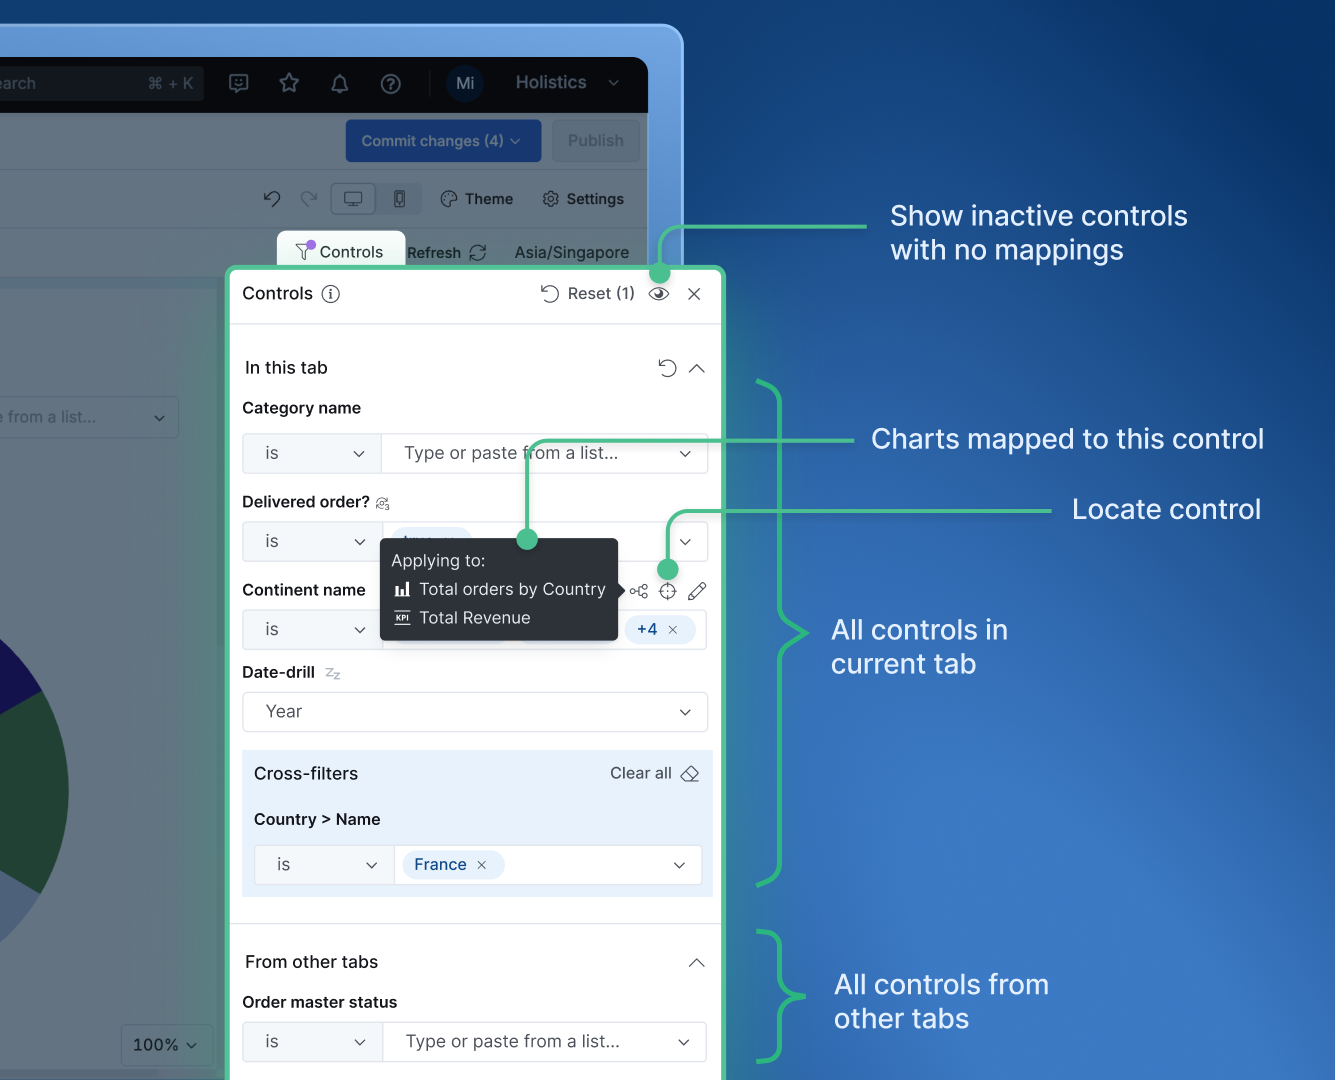
What you can do with the controls & filters panel:
- Quickly locate any filter on the dashboard
- Apply filters directly from the panel
- See changed filters (marked with purple dots)
- Reset filters at current tab, specific tabs, or entire dashboard
- View which visualizations each filter maps to and identify unmapped filters
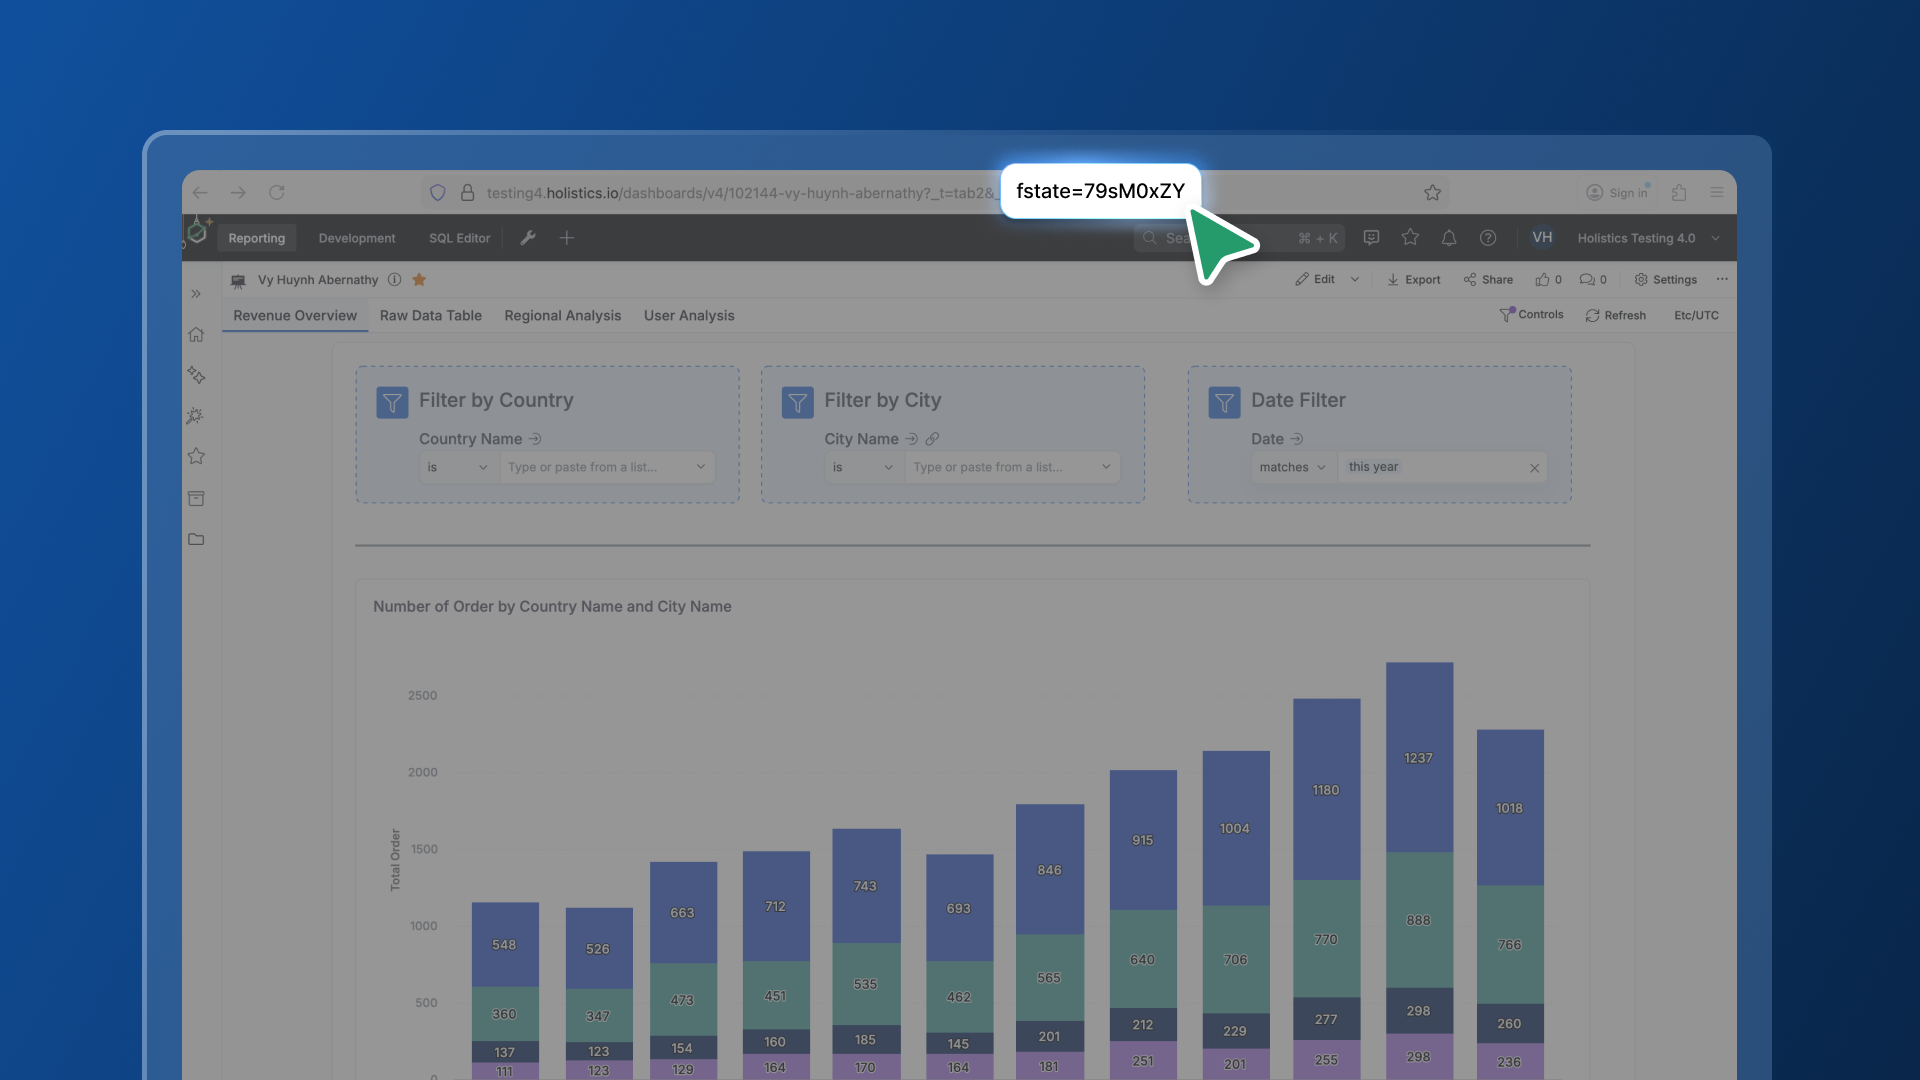
Share dashboard with filters
When you apply dashboard filters, the URL automatically updates to include your filter state (e.g., dashboard/sales-overview?_fstate=qKs9pdVM). Share this URL with others to give them the exact same filtered view (perfect for highlighting specific insights or focusing discussions on relevant data).
Advanced Filtering Options
Holistics also supports other advanced filtering options:
Other scenarios you may encounter when applying filters
Ready to explore your data? Start with local conditions for quick exploration, use dashboard filters for broad analysis, and combine both for precise data investigation. For interactive data discovery, explore Cross-Filtering.