Text Block in Canvas Dashboard
Introduction
Text blocks allow you to incorporate context and information into your Canvas Dashboard. There are two ways to use them:
- Static content: Add formatted text, links, images, and embedded media using Markdown and HTML.
- Dynamic content: Display live, data-driven content using Dynamic Content Blocks.

Static Content
Text blocks support Markdown, a markup language for formatting text in a plain text editor. You can use markdown to format text, insert links, add images, and embed external content to your dashboard.
For more information on markdown syntax, see this guide.
Creating A Static Text/Markdown/HTML Block
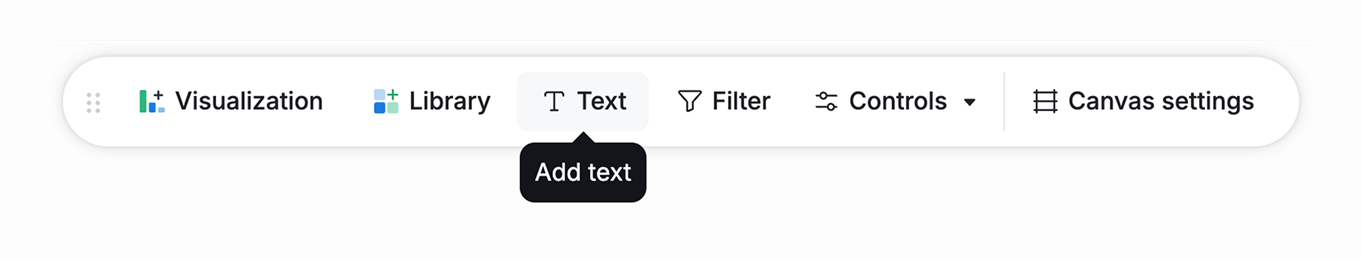
To add a text block, click the "Text" button in the dashboard toolbar.
Using HTML
You can use the HTML in the Text block to have Holistics render HTML instead of just showing plain text. Common use cases can be:
- Use HTML to style text with in-line CSS.
- use HTML's
img/videotag to embed videos and images in your dashboard.
Here is an example code of how to add an image/video to the Holistics dashboard:
<img src="insert-link" width="50%" height="50%"/>

<video width="290" height="130" controls autoplay>
    <controls>
    <source src="insert-link" type="video/mp4">
</video>
Using Markdown inside HTML
Since our markdown engine follows the CommonMark convention if the content has markdown inside an HTML block you need to specify HTML (followed by the start condition and end condition as described here) to ensure the content renders correctly.
Here is an example of text widget content that has a markdown inside HTML:
<div style="width: 500px; height: 500px; background-color: pink">
# Heading level 1
</div>
Examples
Add Table of Contents
# Table of Contents
- [Section 1](#block-v1)
- [Section 2](#block-t1)
- [Section 3](#block-uname)
<!-- Link to the block uname -->
Add images
You can add publicly hosted images with the following syntax .
<!-- replace with the description and URL of the image you want to show -->


Add Youtube videos
<iframe width="600" height="400" src="https://www.youtube.com/embed/Pj81XFRaNBM"></iframe>

Add Mermaid diagrams
```mermaid
flowchart LR
%% Nodes
A("Project Idea"):::green
B("Initial Planning"):::orange
C("Detailed Design <br> & <br> Requirements"):::blue
D{"Decision: Continue or Stop?"}:::yellow
E("Development Phase"):::pink
F("Testing Phase"):::purple
G("Deployment"):::green
H("Feedback and Improvement"):::orange

%% Edges
A --> B --> C --> D
D -- Continue --> E --> F --> G
D -- Stop --> H
G --> H
H --> B

%% Styling
classDef green fill:#B2DFDB,stroke:#00897B,stroke-width:2px;
classDef orange fill:#FFE0B2,stroke:#FB8C00,stroke-width:2px;
classDef blue fill:#BBDEFB,stroke:#1976D2,stroke-width:2px;
classDef yellow fill:#FFF9C4,stroke:#FBC02D,stroke-width:2px;
classDef pink fill:#F8BBD0,stroke:#C2185B,stroke-width:2px;
classDef purple fill:#E1BEE7,stroke:#8E24AA,stroke-width:2px;
```

Dynamic Content
To display live data that updates automatically, use Dynamic Content Blocks.
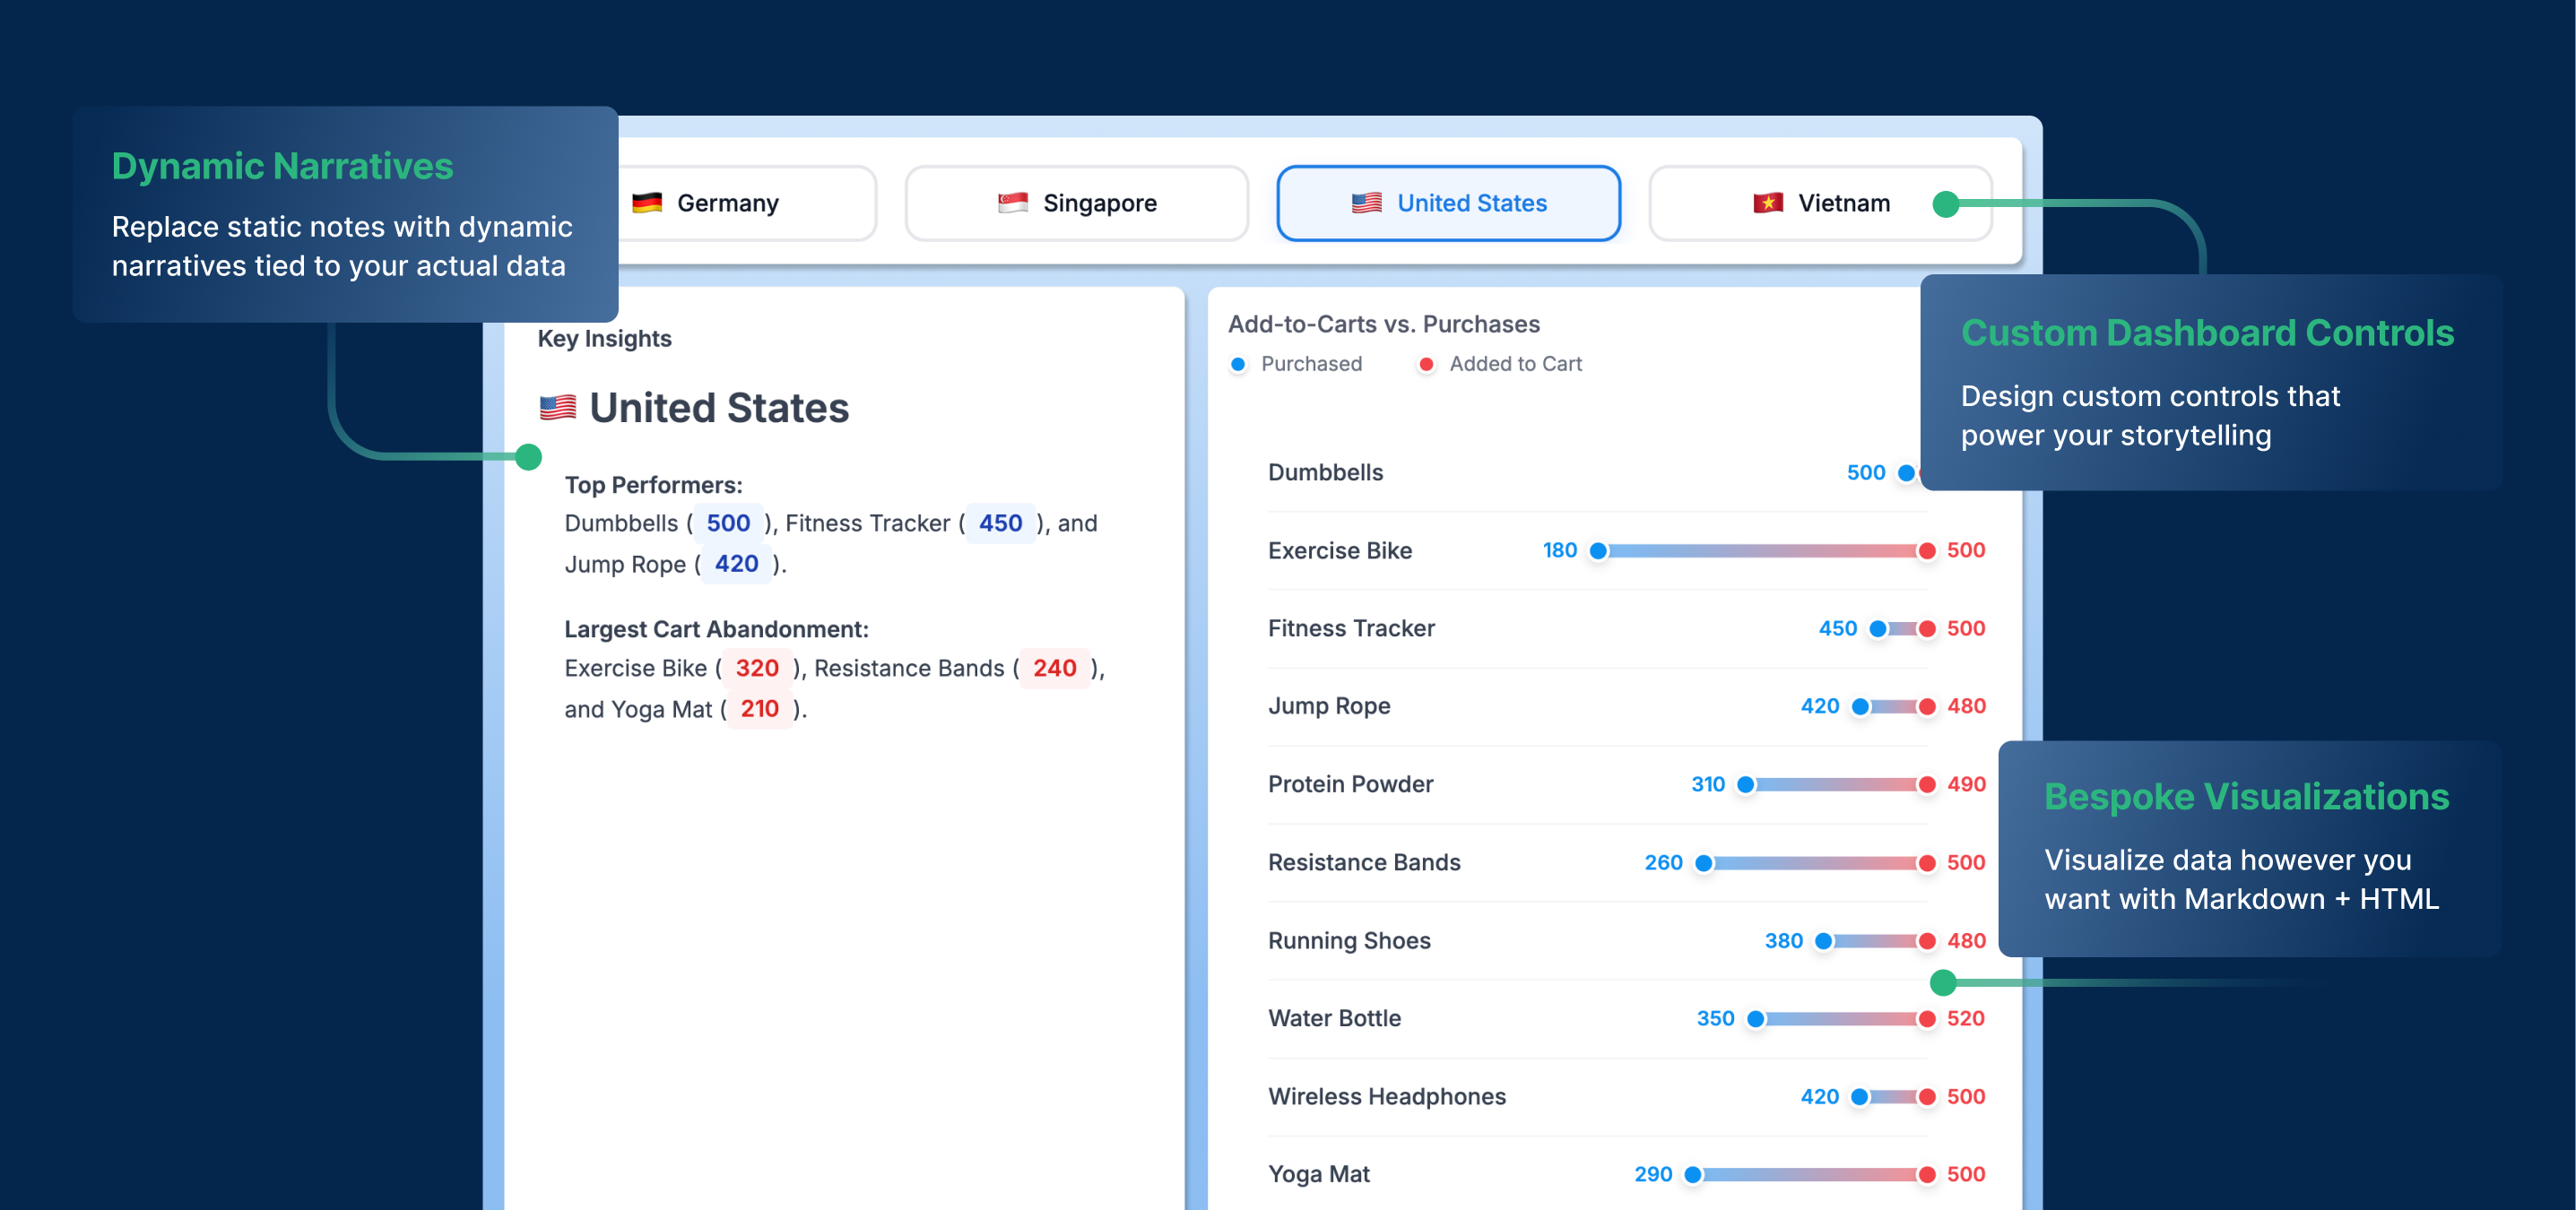
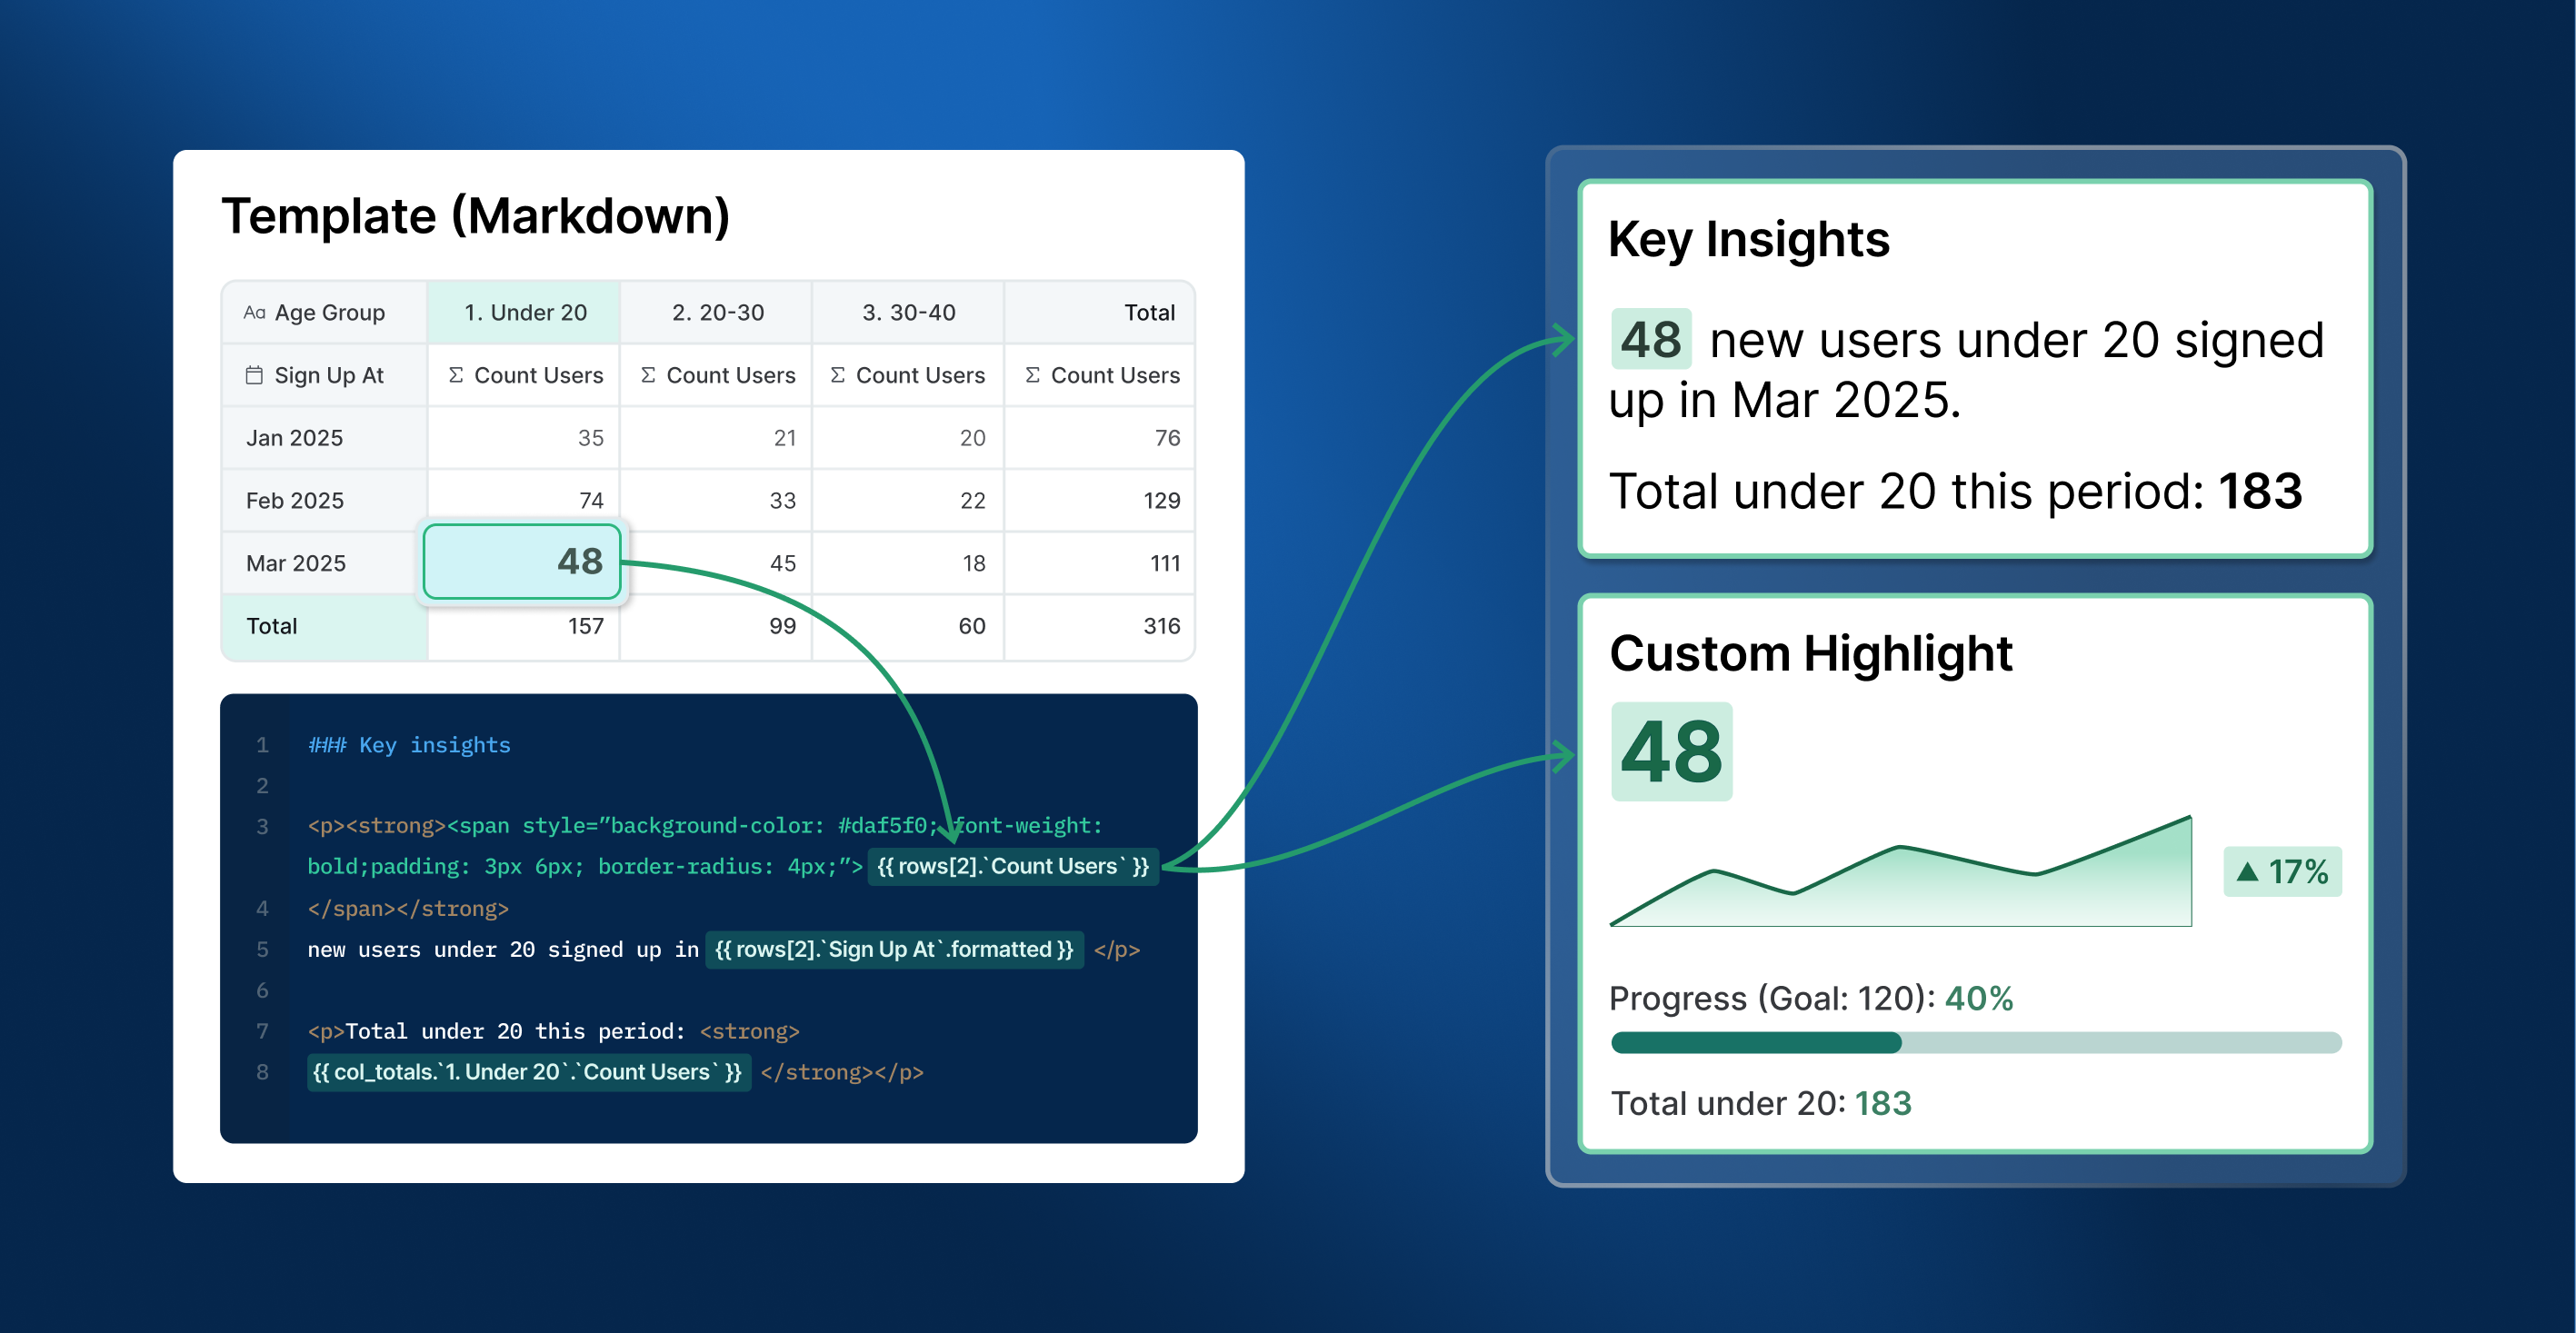
Dynamic Content Blocks combine your data with HTML/Markdown templates to create data-driven content such as narrative insights, custom visualizations or dashboard controls.
Examples
Executive summary with live metrics and conditional formatting:
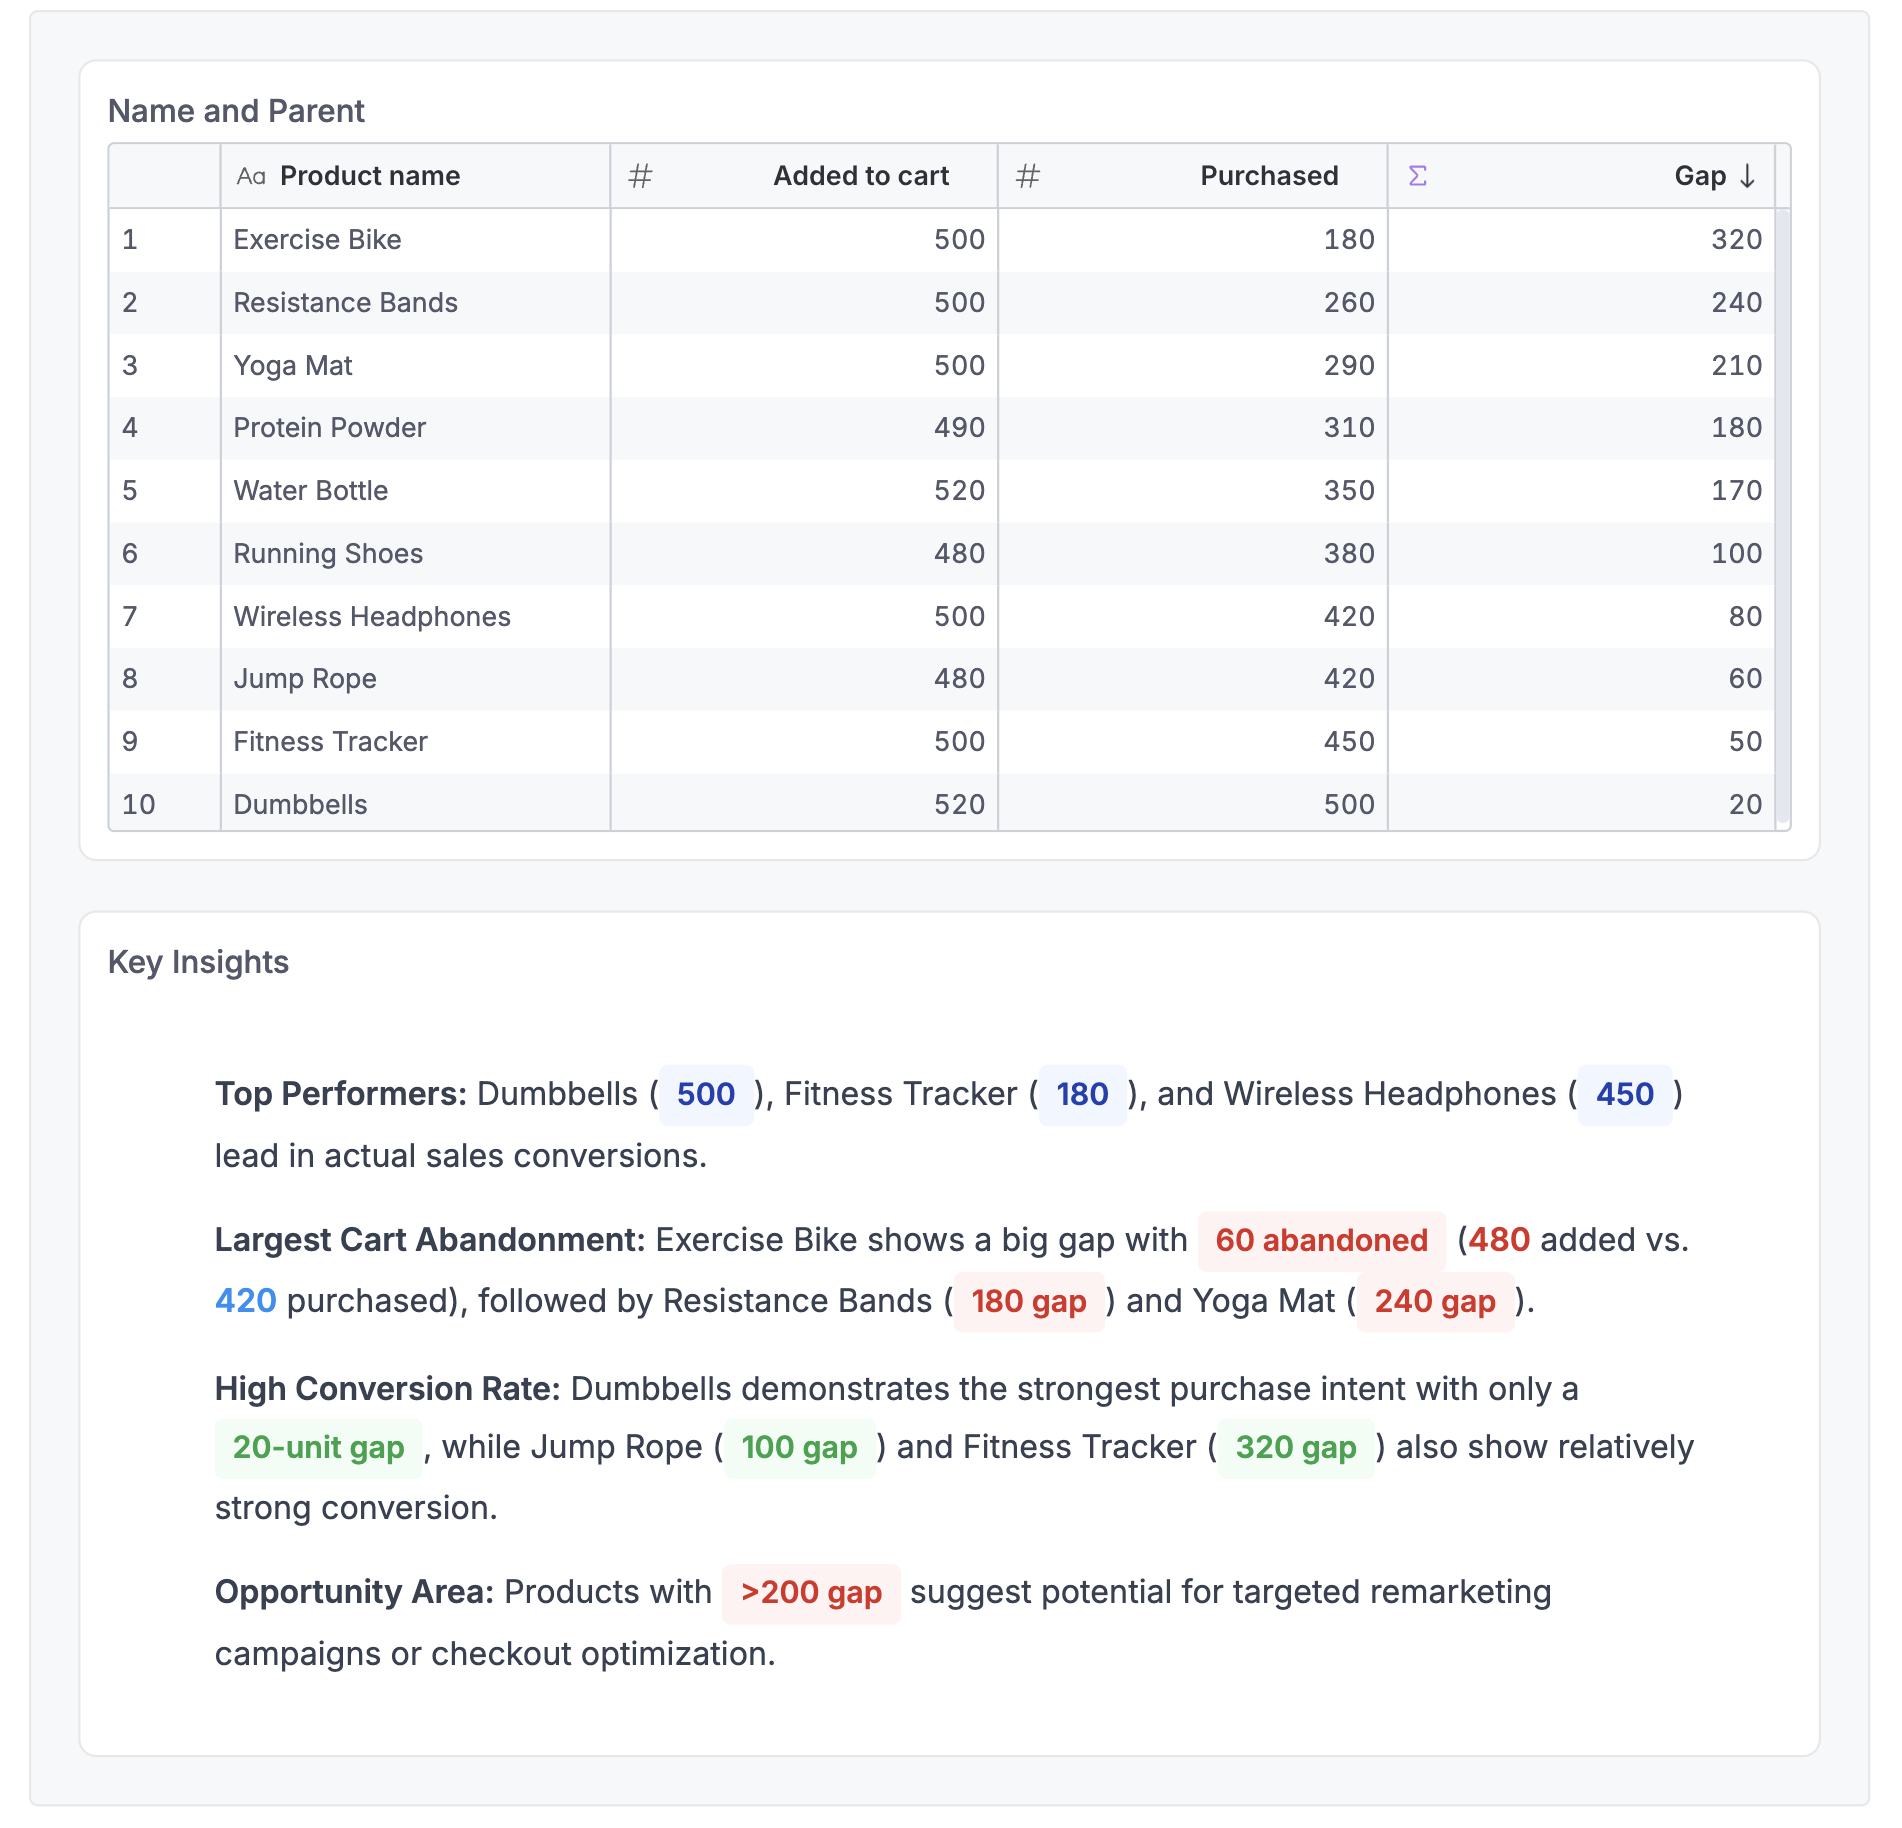
Product cards grid with images and live data:
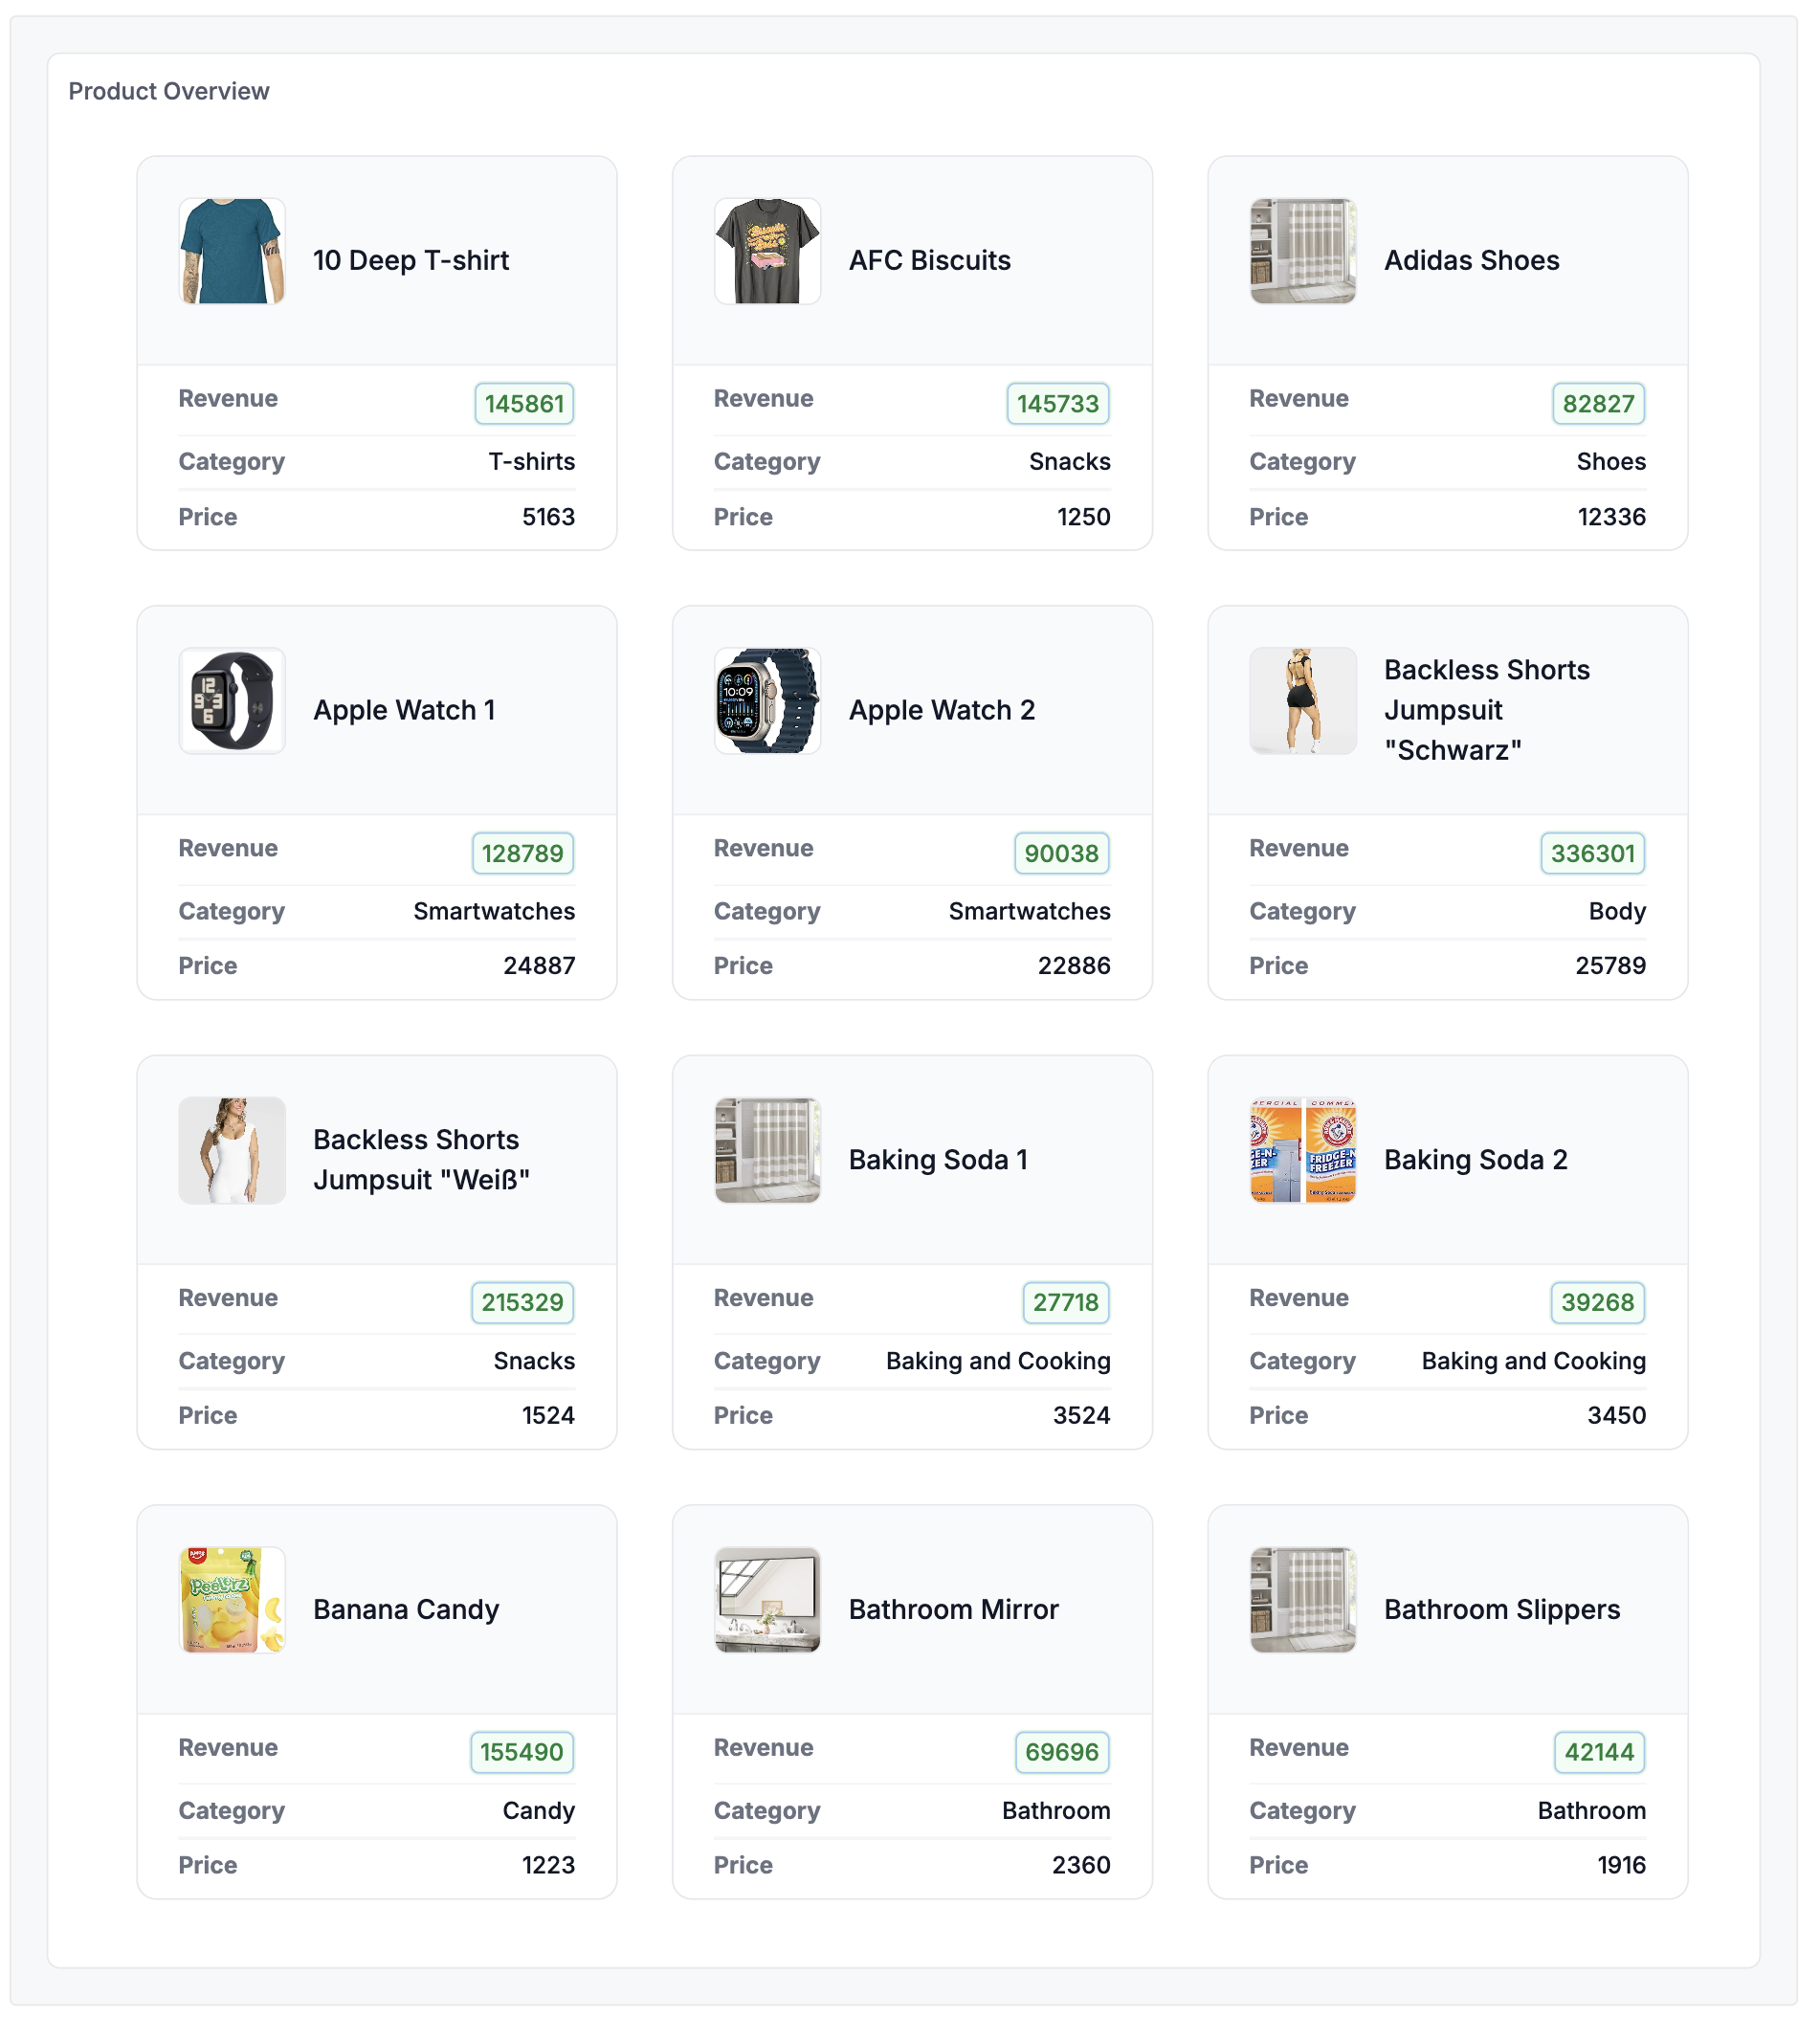
For more examples and a step-by-step guide, see Dynamic Content Blocks.