Quick Dashboards
Holistics offers two dashboard types: Canvas Dashboards and Quick Dashboards. We highly recommend using Canvas Dashboards. It's our latest and most innovative version, offering the best experience while Quick Dashboards is an older, legacy version.
For more details on the differences between these two dashboard types, please refer to this section.
Introduction
Quick Dashboard is a collection of widgets that help you tell a story or paint a big picture of your organization. This is where you save your ad-hoc data exploration into something permanent and deliver continuous value to your end users.
We are still maintaining Quick Dashboard for tenants using Holistics 3.0, but plan to deprecate it. Learn more here.
Quick Dashboard editor

- Main Editor: The main area to build the dashboard and apply interactive controls.
- Settings & Deliver data: Edit dashboard time zones, cache, other preferences, and deliver dashboard with export and shareable link.
- Generate Canvas Dashboard: Create another version in Canvas Dashboard. You will now have two dashboards: the original Quick Dashboard and the new Canvas Dashboard.
Quick Dashboard components
A Quick Dashboard is composed of Widgets and Filters.
Widgets
There are two types of widgets: Report widget and Text widget.
-
Report widgets are used to visualize your data. Since Report widgets are backed by datasets, you can freely explore the underlying data. For more information on the types of reports, you can refer to Visualization.

-
Text widgets are used to provide additional instructions, context, and warnings directly in your dashboard. The widget supports Markdown, which should serve your most common formatting requirements. Learn more with Text, Markdown, HTML.

Filters
Filters allow viewers to limit results to specific data of interest. When interacting with the dashboard filter (selecting operators, filter values...), a relevant WHERE condition applies to widgets using it.
How to create a Quick Dashboard
Create a dashboard
-
Create from scratch: You can create a new Quick Dashboard from several places in Reporting: From top navigation bar, from left sidebar, or inside a folder.
-
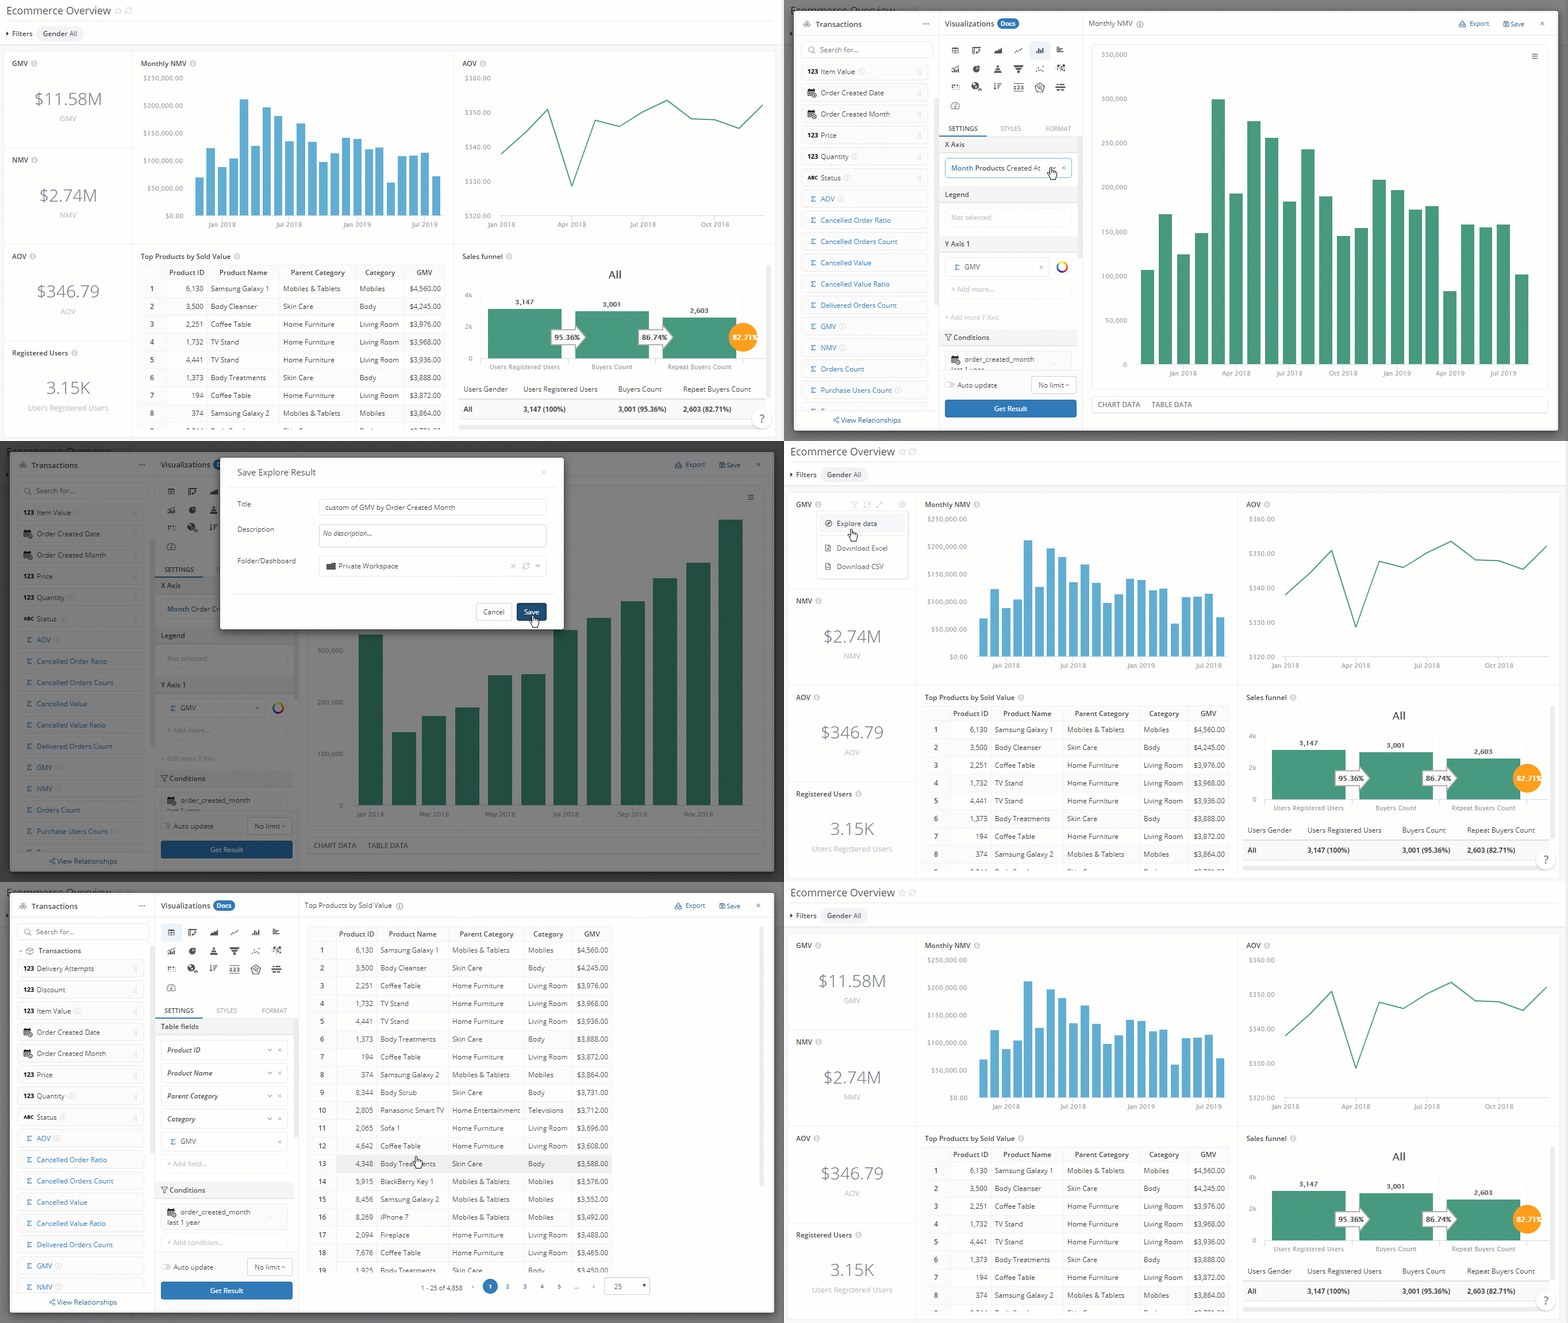
Save explore result to a dashboard: When you find something meaningful when exploring a dataset, you can save your results. Holistics allows you to save exploration results directly to an existing dashboard or to a new one.
Add widgets and filters
After creating a dashboard, you can start adding widgets and filters directly from the dashboard page.
Compare Canvas Dashboard and Quick Dashboard
| Canvas Dashboard (Recommended) | Quick Dashboard | |
|---|---|---|
| Definition | A flexible canvas that generates code underneath the hood for analysts to easily maintain and scale your dashboard. | A simple, built for solo analysis, suitable when you need an ad-hoc report. |
| Development | ||
| Layout | Freely arrange visualizations, texts, filters, etc. anywhere on Canvas | Visualizations, and texts are arranged onto fixed-size grids. Filters and dashboard controls are always on top |
| As-code definition | Declarative AML as-code definition | Not supported |
| Reusability | Inherit AML's reusability | Not supported |
| Version control | Version control with Git integration | Not supported |
| Development experience | Develop dashboard in Modeling layer. Changes are applied after publishing to production | Develop dashboard in Reporting layer. Changes are automatically applied |
| View & Interaction | ||
| Responsiveness & Scaling | Keep the dashboard ratio. Allow users to zoom in/out the dashboard to fit their screen. Control the size of canvas in pixels | Auto-resize the dashboard to fit the users' screen. Dashboards look differently on different screens |
| Filters, Date Drills, Period Comparison | Place anywhere within dashboard. Support easy reset to default values | Always stay on top of dashboard. Manually reset to default values |
| Cross-filtering | Support ability to selectively apply/exclude cross-filtering to a subset of visualizations. Cross-filtering triggers when clicking on Apply controls | When enabled, cross-filtering is applied to the whole dashboard (among visualizations using the same datasets). Cross-filtering automatically triggers on click |
| Drill-through | Support Drill-through between multiple Canvas Dashboards | Support Drill-through between multiple Quick Dashboards |
| Export | Export dashboard: Support export as PNG/PDF | Export visualizations: Support export as PDF/Excel/CSV |
| Data Schedules | Support send to Email / Slack / Google Sheets / SFTP | |
| Data Alerts | Support send alerts to Email / Slack / Webhook | |
| Embedded Analytics | Support create Embed Link in Dashboard Preferences | |
| Explore data from dashboards | Admin, Analyst, and Explorer can explore a visualization in a dashboard, but cannot save the exploration results | Admin, Analyst, and Explorer can explore a visualization in a dashboard, and save the exploration results to another dashboard |
| Private dashboards | Not supported | Admin, Analyst, and Explorer can create new dashboards in private workspace. |