Canvas dashboard
Holistics offers two dashboard types:
- Canvas dashboard: Our latest, most innovative dashboard. We highly recommend using canvas dashboards for the best experience and advanced customization.
- Quick dashboard: Now a legacy version. Please note that this version has been deprecated for all new accounts created since February 10, 2026.
For more details on the differences between these two dashboard types, see this comparison section.
Introduction
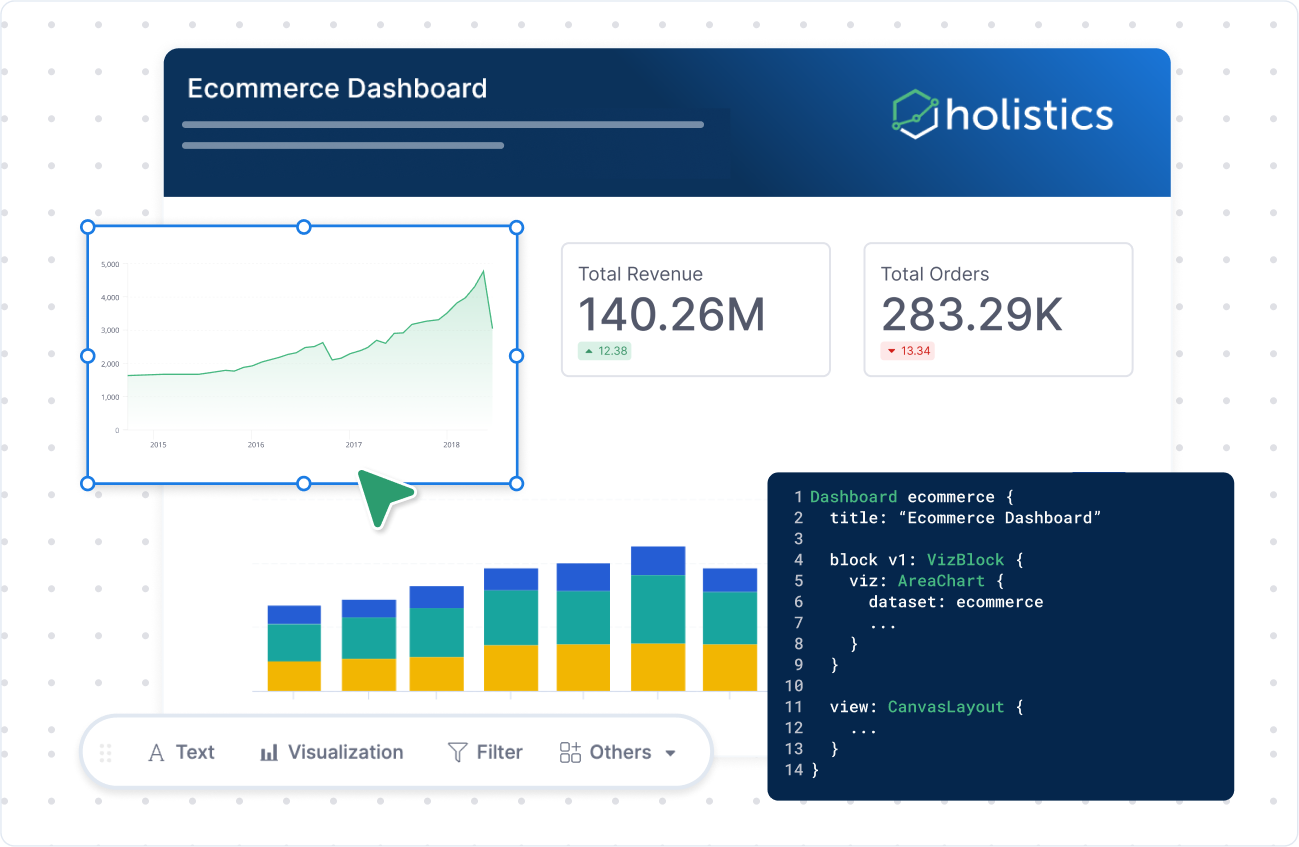
Canvas dashboard gives you complete design freedom to create data presentations that match your exact requirements. Build executive dashboards, analytical reports, and operational monitors with full control over how your data is presented and organized.
Key features of Holistics canvas dashboards:
-
Flexible layout control: Position visualizations, filters, and text elements exactly where you need them without grid constraints. Arrange your dashboard to support your narrative and meet your specific design requirements.
-
Definition as code: Define your dashboard as code in AMQL for seamless version control through Git, reusable components, and bulk editing at scale.
-
Separate development environment: Build and refine your dashboards in a dedicated Development workspace before deploying to production. This ensures end-users only see completed, ready-to-use dashboards while you work on improvements.

Dashboard components
Canvas dashboards combine two key concepts: Block, and Layout.
Block
A canvas dashboard is composed of modular units called analytics blocks. Think of it like constructing a LEGO castle from individual bricks — each block serves a specific purpose and can be combined in countless ways.
Holistics provides a wide range of blocks:
-
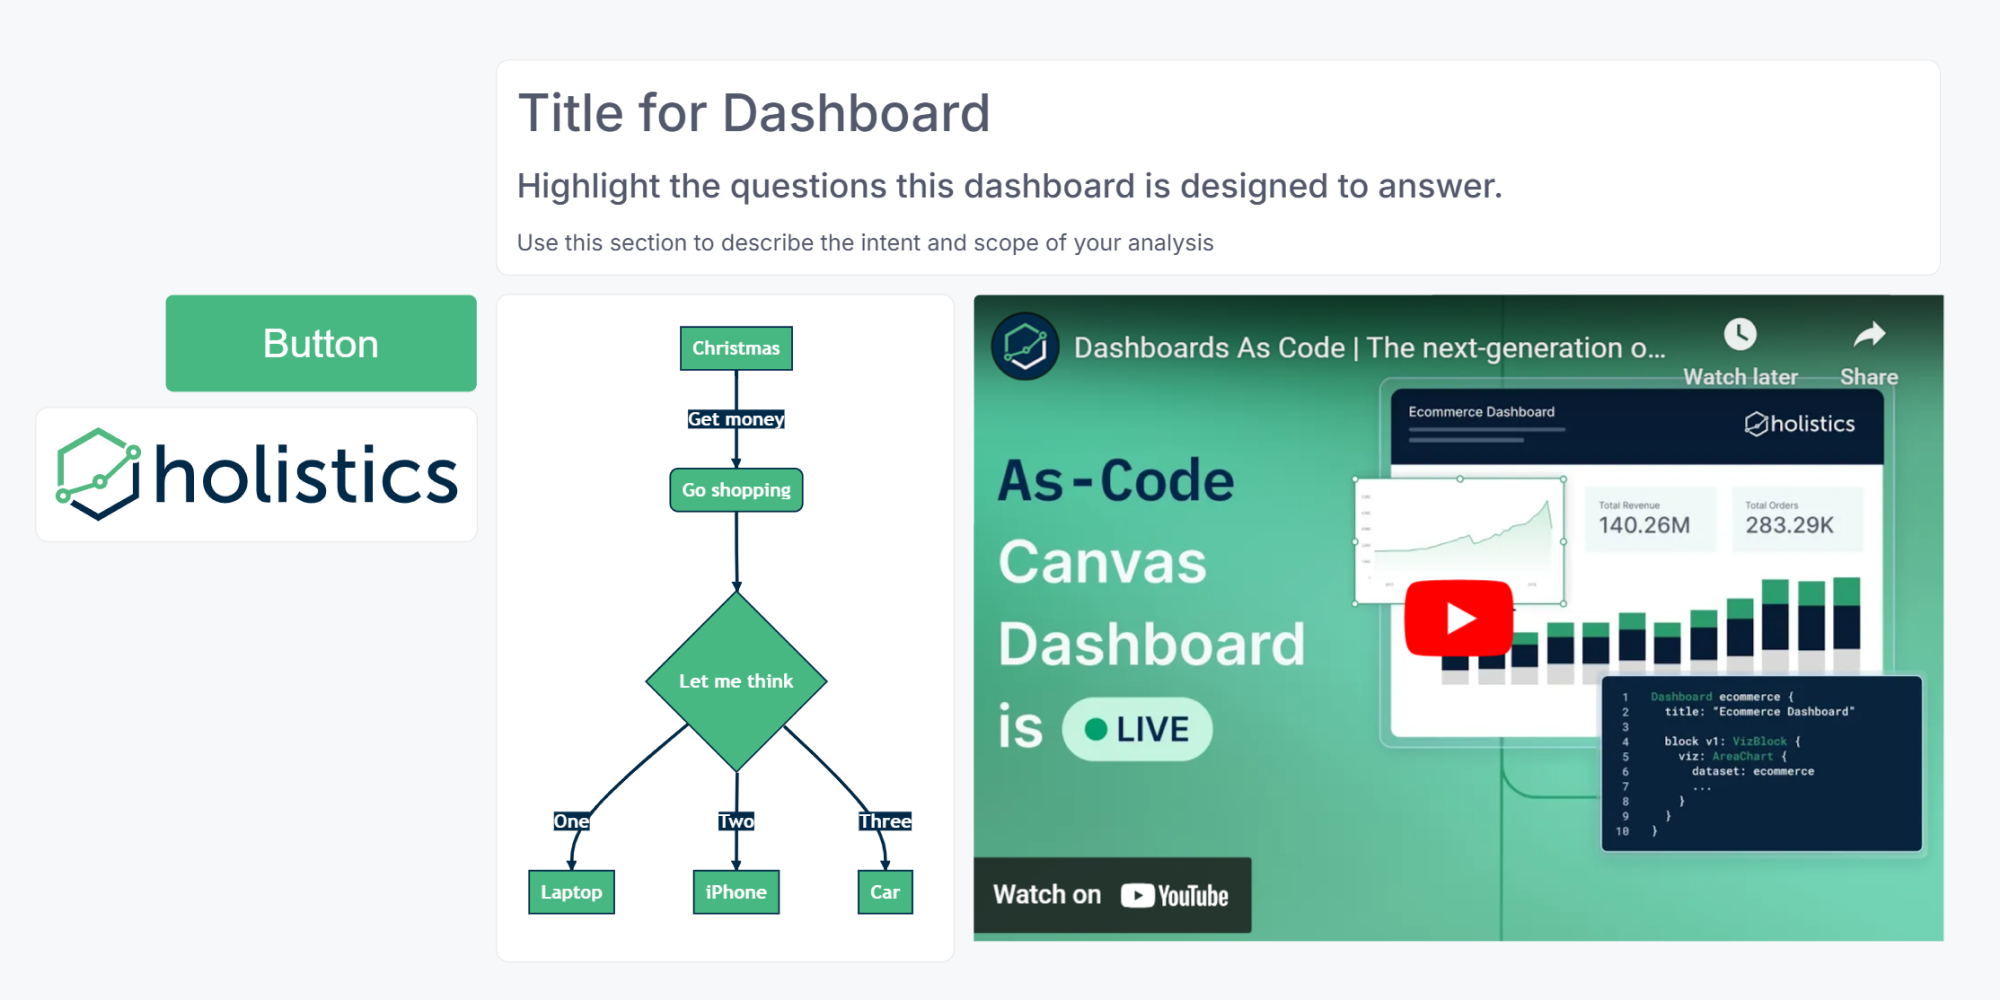
Text block: To incorporate context and information into your dashboards. They support Markdown, images, and embedded videos.

-
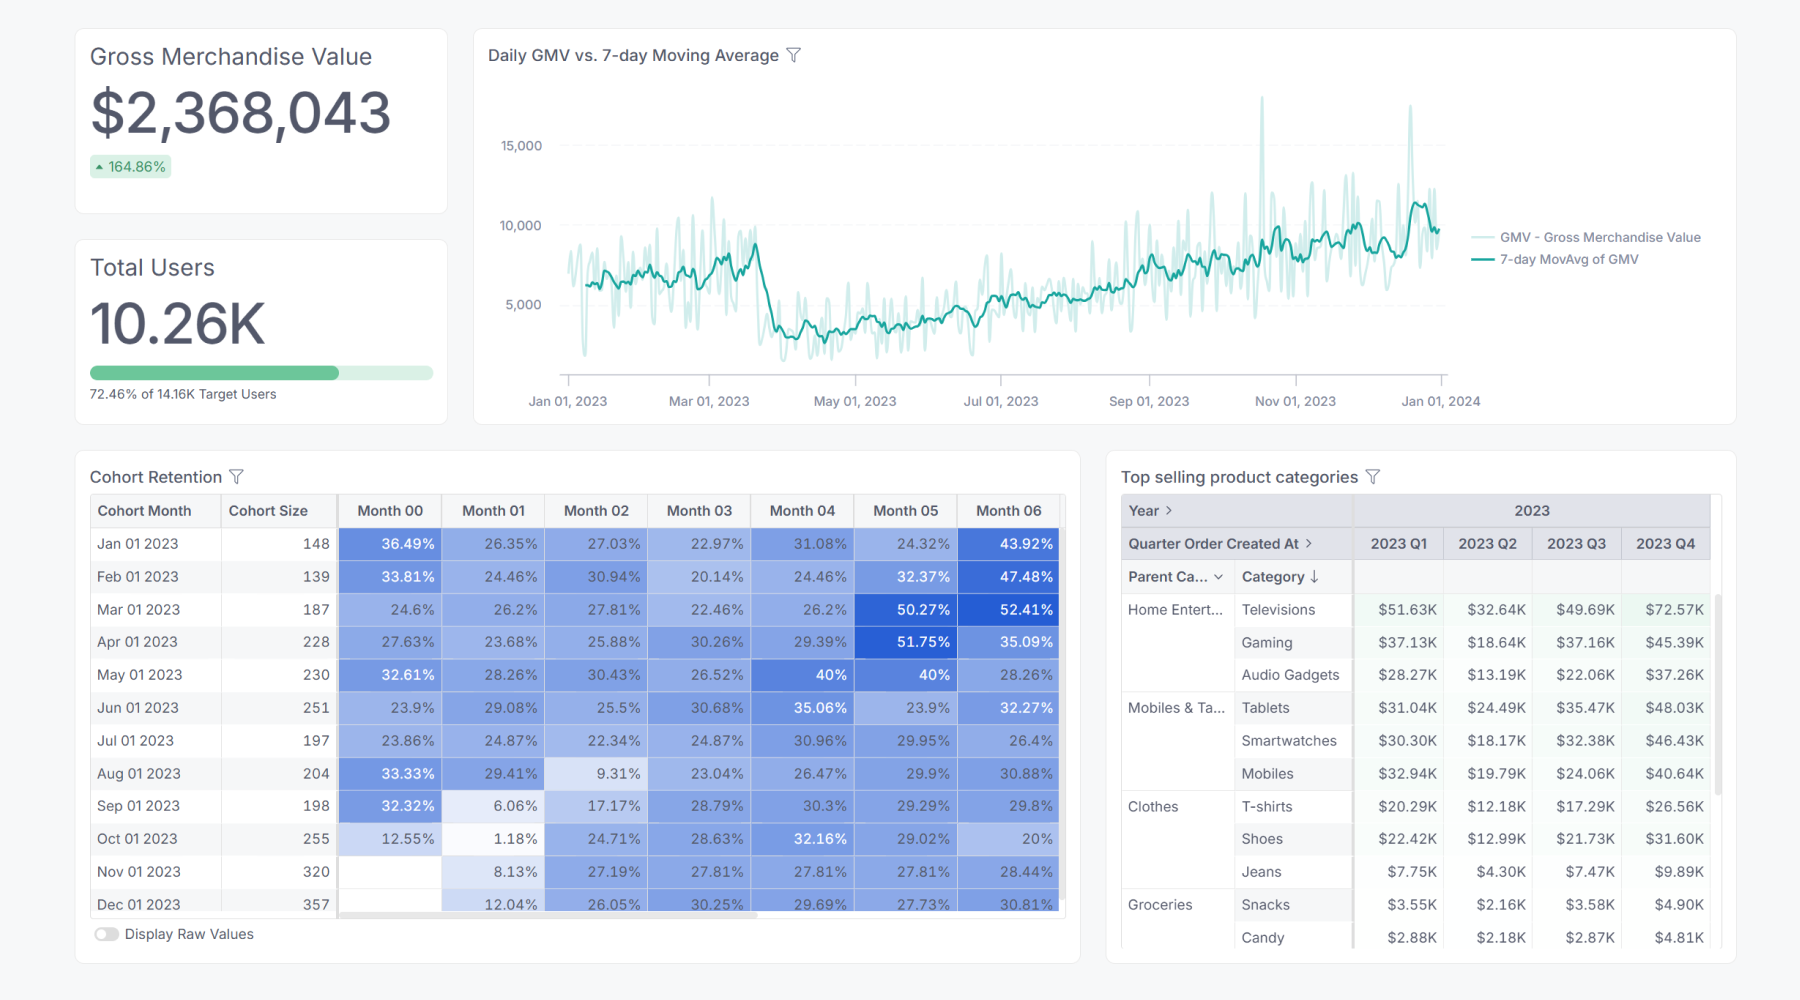
Visualization block: To add a variety of visualizations to your dashboards, including custom charts.

-
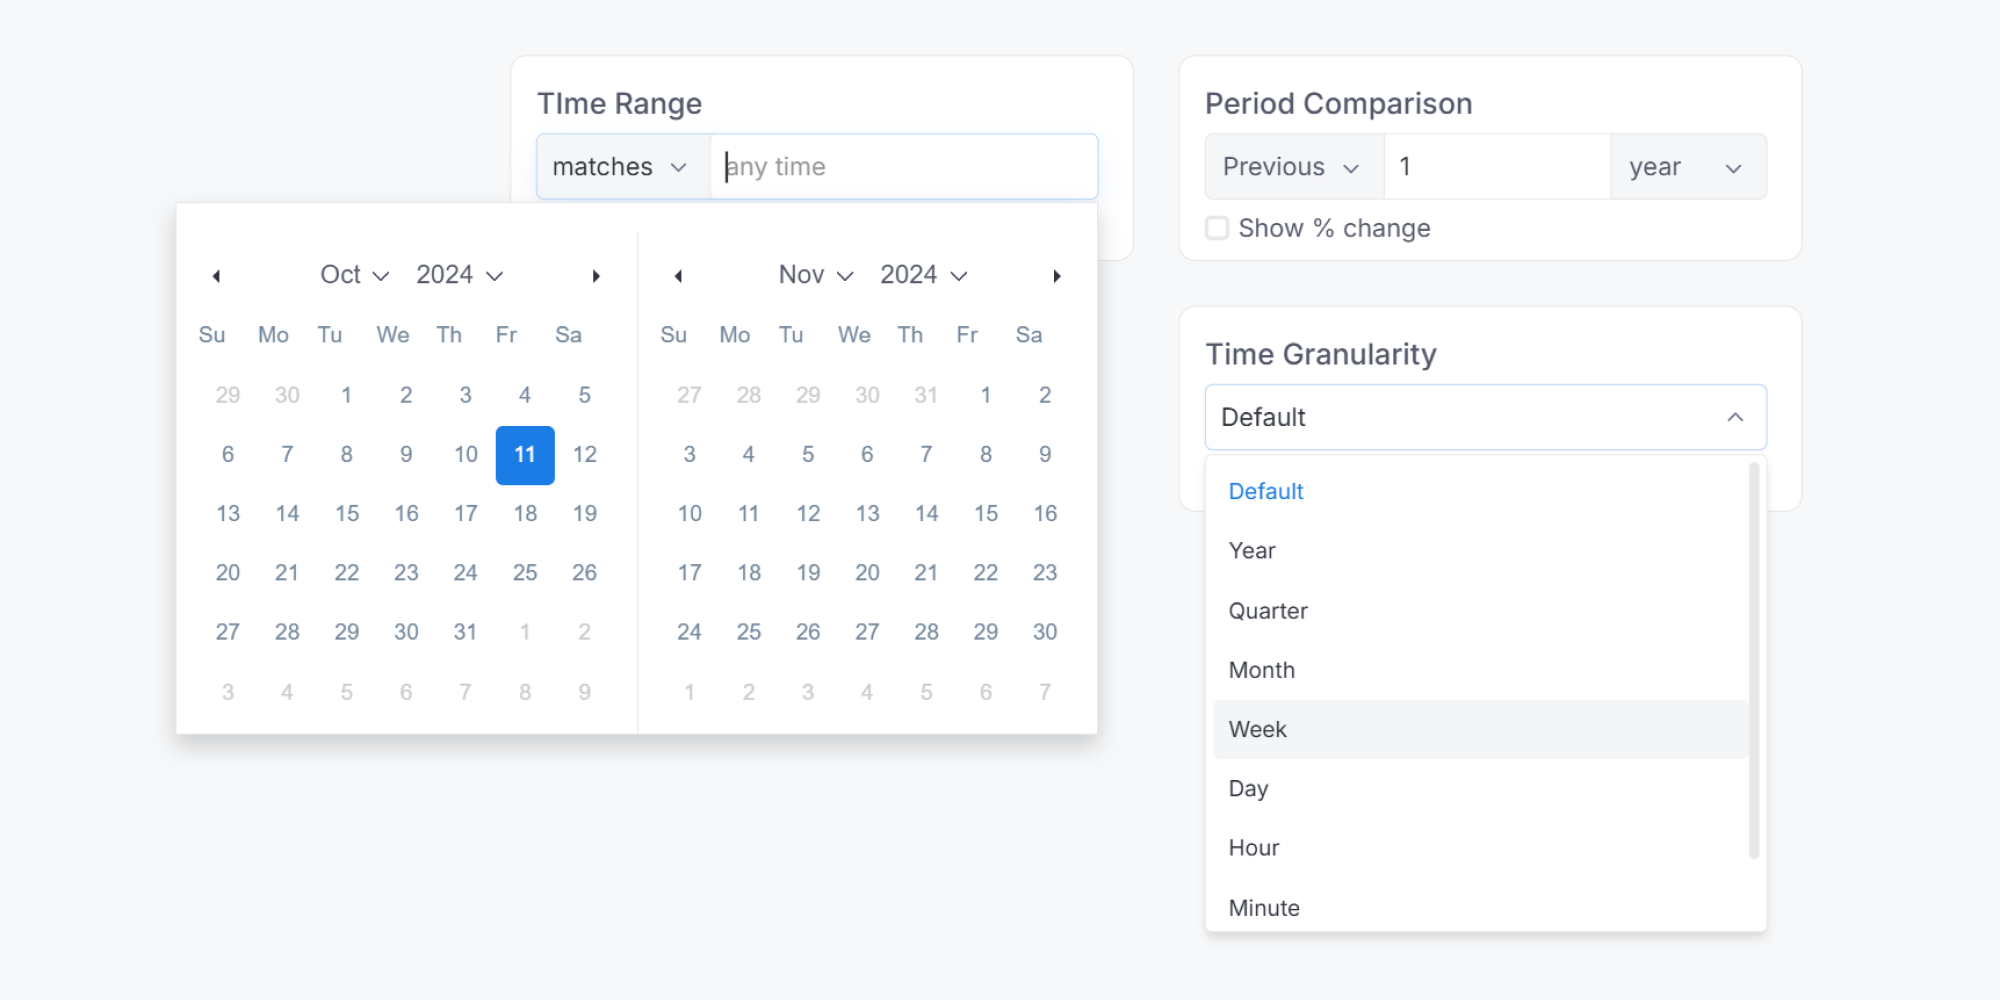
Control block: Such as Filter, Period Comparison, Date Drill, allowing you to manipulate data and add interactivity to your dashboard.

-
Reused block: Let you define a single “main block” and reference it in many dashboards. That way, you can build it once and reuse it multiple times, while having the flexibility to customize where needed.
Layout
Blocks are positioned and organized by a layout. Holistics supports two layout types:
- Canvas layout: A single free-form page; this is the default for new canvas dashboards.
- Tab layout: Functionally similar to canvas layout, but content is split into tabbed sections.
Dashboard as code
When you build a canvas dashboard, Holistics automatically generates its underlying code. This approach allows you to apply engineering best practices to your dashboard development.
This means you can:
- Govern your dashboards with Git version control
- Refactor your dashboards at scale
- Define reusable functions
- Perform code reviews
And much more.
How to create a canvas dashboard
Canvas dashboards in Public workspace are accessible in both Development and Reporting environments.
Personal canvas dashboards are only accessible in Reporting. Support for personal canvas dashboards in Development is under consideration.
Create a dashboard from scratch
You can create a new dashboard in both Development and Reporting environments:
-
Development (for admins / analysts): This environment is designed for creating, modifying, and reviewing dashboard changes with full version control. In addition, you’ll get access to both a code editor and a visual editor, allowing you to work directly with our Analytics Modeling Language (AML) or use a drag-and-drop interface.
Learn more in Developing in Development.
-
Reporting (for all authorized users, except for viewers): This environment is ideal for exploring data and making minor changes if you have the necessary permissions. It offers only the visual editor, which means you'll have limited access to the more powerful “as-code” functionalities.
Learn more in Developing in Reporting.
Save explore result to a dashboard
When you find something meaningful when exploring a dataset, you can save your results. Holistics allows you to save exploration results directly to an existing dashboard or to a new one.
- Development: Can only save explore results to canvas dashboards.
- Reporting: Can save explore results to both quick dashboards and canvas dashboards.
FAQs
1. How can we get access to the canvas dashboard?
Canvas dashboard is available exclusively on Holistics version 4.0. Please ensure you are using this version. If not, you can migrate your Holistics instance to version 4.0.
2. What happens to my existing dashboards if I migrate from Holistics version 3.0 to 4.0?
Your existing dashboards will remain fully functional and unchanged after the migration. Holistics 4.0 is fully backward compatible for your account, so you can continue to use both quick dashboards (your current version) and the new canvas dashboards side-by-side. Everything will continue to work exactly as expected.
Our recommendation: While your existing dashboards are supported, we strongly recommend converting them to canvas dashboards. As our most modern and innovative version, Canvas dashboard offers the best overall experience and advanced capabilities, whereas Quick dashboard is now maintained as a legacy version.
3. I'm using both canvas dashboards and quick dashboards. Is the older version going to be deprecated, and when?
While we have already moved to canvas-only for accounts created after February 10, 2026, there is no finalized deprecation date for existing users. The earliest potential timeframe for retiring quick dashboards is the end of 2026. We will provide at least a six-month advance notice before any changes occur to ensure you have plenty of time to transition.
In the meantime, we recommend using canvas dashboards for any new work to take advantage of our latest features.
4. How to generate a canvas dashboard from a quick dashboard?
Prerequisites:
To convert a quick dashboard to a canvas dashboard, ensure the following:
- You are on Holistics version 4.0.
- You have an admin, analyst, or explorer role.
How to generate:
- Click the ⬆️ button on your quick dashboard.
- Choose the saving folder in:
- Public workspace: You can only choose folders where you have create & edit child or edit permission.
- Personal workspace: You can save to any folder.
- This process doesn't affect your original quick dashboard. You'll have two separate dashboards: the original quick dashboard and the newly created canvas dashboard.
- The new canvas dashboard might not perfectly match the visual style of your old dashboard due to design differences. We recommend reviewing the preview version first.