Canvas dashboard settings
This doc covers settings for Canvas dashboards in two categories:
- Layout settings help you design and arrange components while building your dashboard. These settings are unique to canvas-based dashboards.
- General dashboard settings control how your dashboard runs and displays for end users.
Layout settings
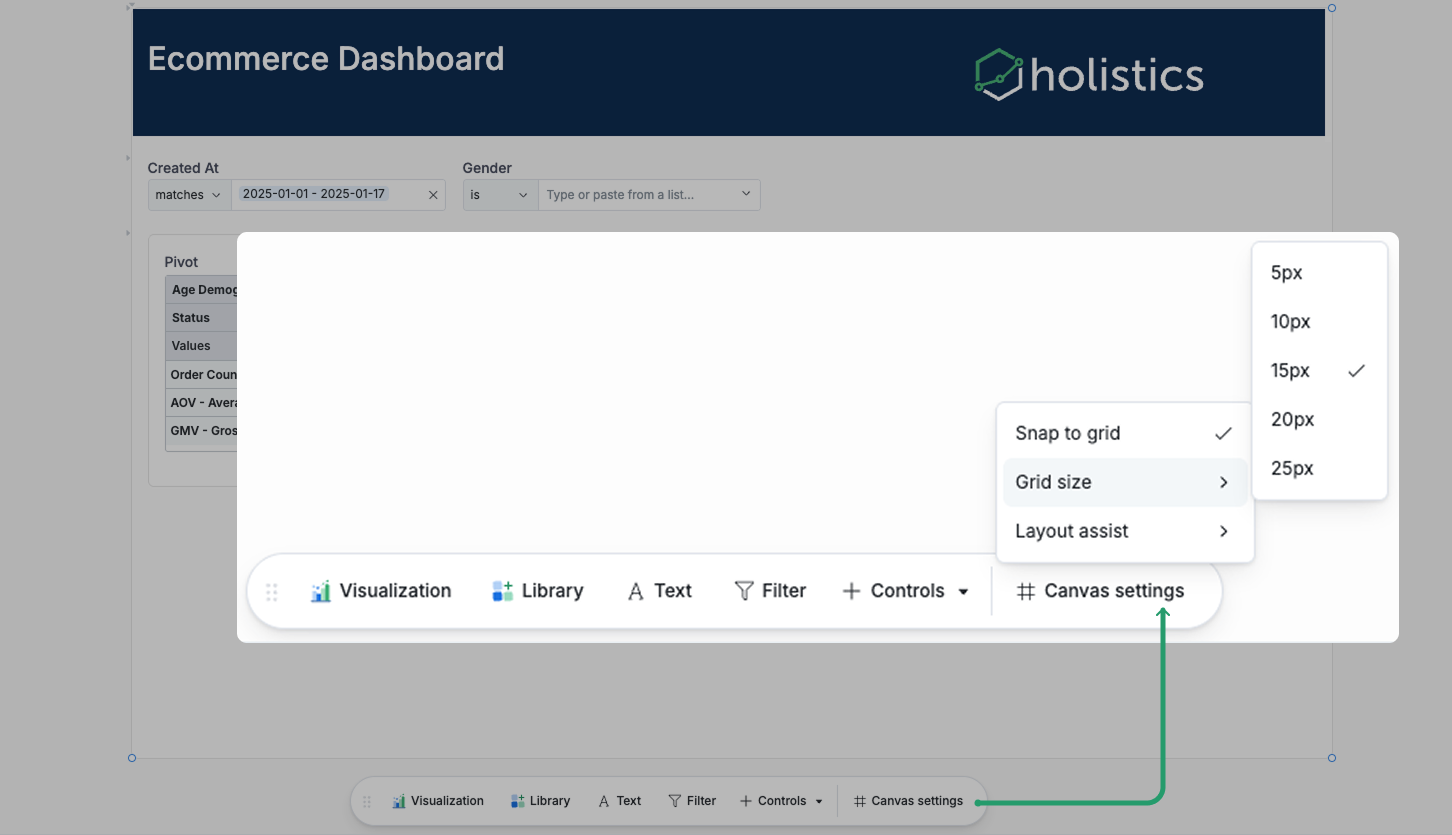
Grid settings
Enable Snap to grid to automatically align blocks to an invisible grid as you position them. This helps you create neat, consistently-spaced layouts.
When snap to grid is on, you can set the Grid size to control how fine or coarse the alignment points are. Smaller grid sizes give you more precision, while larger sizes enforce more spacing between elements.
Layout assist
This setting includes smart features that make it faster and easier to arrange dashboard components:
- Prioritize non-overlap: Blocks automatically avoid overlapping as you drag them around. To manually layer blocks, press and hold one for 2 seconds.
- Smart trimming: Detects excess whitespace in your dashboard and removes it with one click.
- Smart shifting: Move multiple blocks together at once instead of repositioning them individually.
- Auto-expand canvas: The canvas grows automatically when you add blocks near the edge, so you never run out of space.
Zoom settings
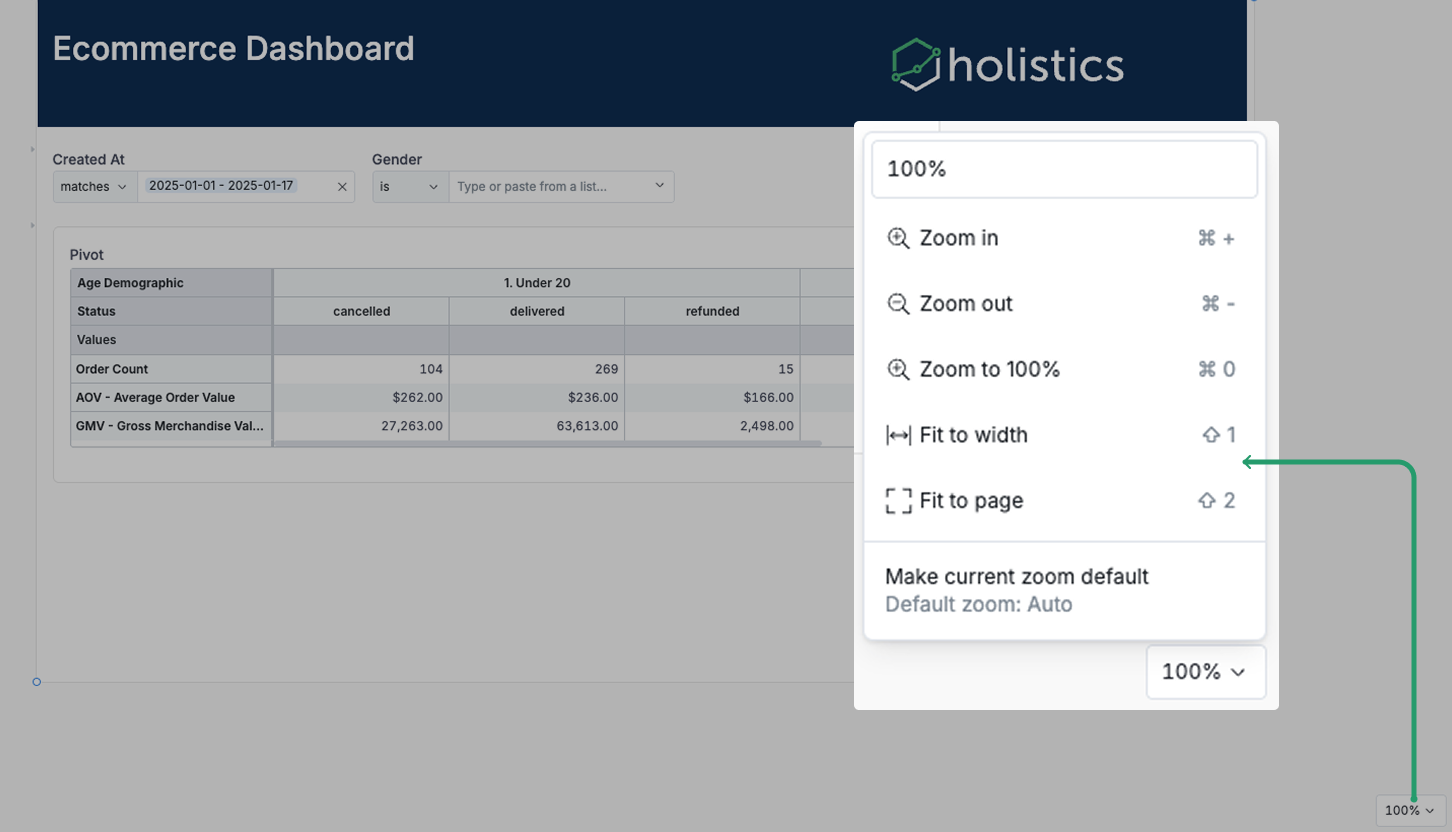
Adjust your canvas dashboard view while editing with flexible zoom controls:
- Zoom in/out: Adjust your dashboard view incrementally
- Zoom to 100%: Return to actual size of the dashboard
- Fit to width: Scale dashboard to match your screen width
- Fit to page: Fit the entire dashboard in your viewport
You can also enter a custom zoom percentage directly in the zoom field.
Set a default zoom level
To make a canvas dashboard always open at a specific zoom level:
- In edit mode, adjust zoom to your preferred view
- Click Make current zoom default and save your changes
General dashboard settings
These settings are only available in Reporting environment: User access, Data schedules, Shareable links, Embedded analytics.
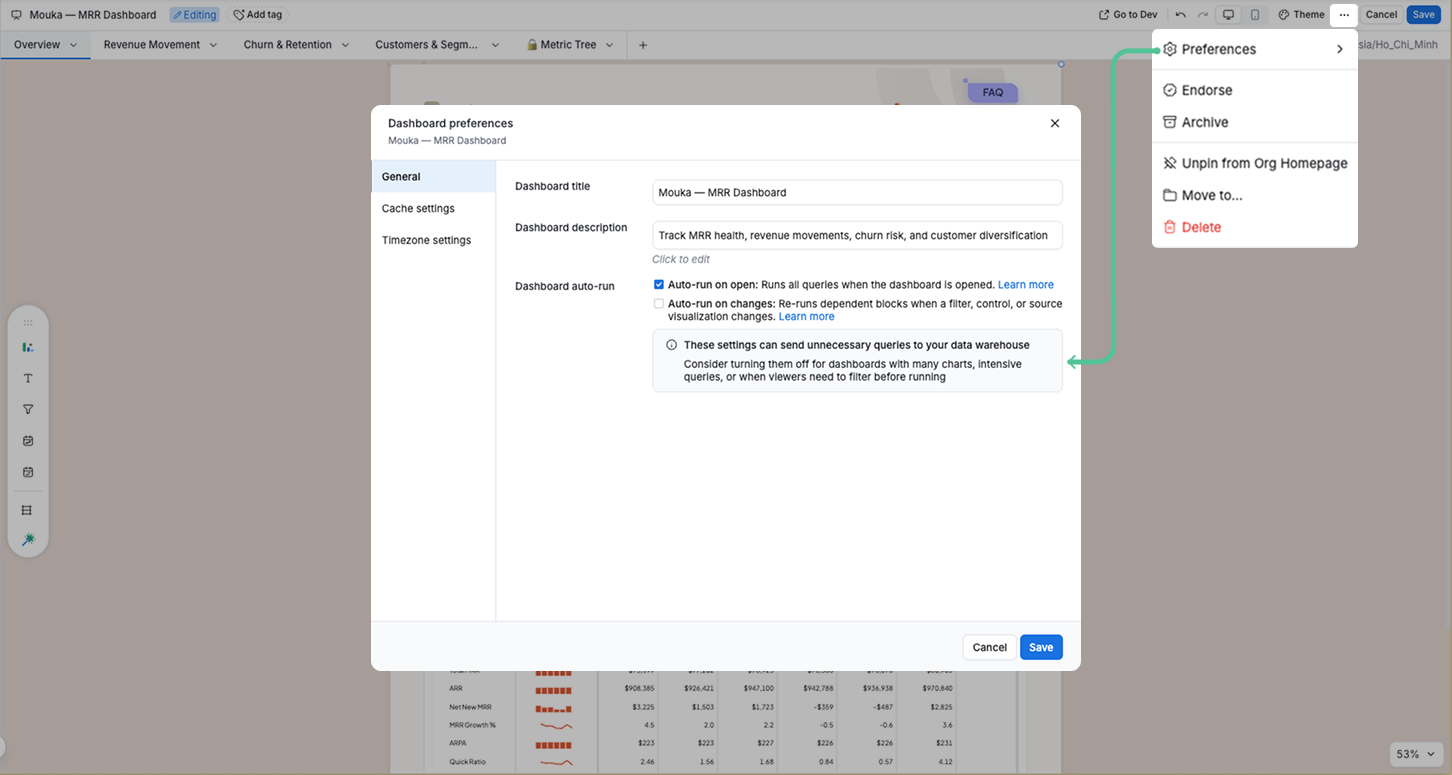
Dashboard auto-run
Two settings control when the dashboard executes queries. Both are configured in Dashboard Preferences > General.
These settings do not apply to Shareable links, Embed links, and dashboard URLs with pre-applied filters.
Auto-run on open
By default, dashboards run all widgets automatically when opened. You can turn this off to give viewers control over when data loads.
When disabled, the dashboard stays blank until the viewer manually triggers it:
- Click Run Dashboard to load all widgets
- Apply a filter to run dependent widgets
- Click Refresh to reload the dashboard
Benefits of disabling:
- Give viewers control over when to load data, reducing the initial wait time
- Minimize unnecessary queries to your data warehouse
- Free up Job Workers for higher-priority tasks
How to configure:
- Go to Dashboard Preferences > General
- Toggle Auto-run on open and save your changes
- Apply the change:
- In Development mode: Publish your changes to Production
- In Reporting mode: Reload the page
Auto-run on changes
When enabled, the dashboard re-runs automatically whenever a filter, control, or source visualization changes - no Apply button needed. This setting is off by default to avoid unexpected query costs on dashboards with many charts or intensive queries. Builders opt in for dashboards where immediate feedback matters and query cost is acceptable.
When to use: Simple dashboards or dashboards used by non-technical viewers who expect data to update immediately after changing a filter.
How to configure:
- Go to Dashboard Preferences > General
- Toggle Auto-run on changes and save your changes
- Apply the change:
- In Development mode: Publish your changes to Production
- In Reporting mode: Reload the page
Cache settings
Control how long dashboard query results are stored before refreshing. Caching speeds up load times and reduces data warehouse load by reusing recent results. This is useful when your data updates infrequently or when many users access the same dashboard.
Learn more: Data caching
Timezone settings
Set the timezone for how dates and times display in your dashboard. This ensures all users see data in the correct time context, which is especially important for time-sensitive metrics or teams across different regions.
Learn more: Dashboard timezone
User access
Control who can view and edit your dashboard. Learn more: Dashboard-level permissions
Data schedules
Set up automated email deliveries of your dashboard on a recurring schedule. Learn more: Data schedules
Shareable links
Create public or password-protected links to share your dashboard with people outside your workspace. Shareable links let you distribute dashboards without requiring recipients to have a Holistics account, making it easy to share insights with clients, partners, or stakeholders.
Learn more: Shareable links
Embedded analytics
Configure settings for embedding your dashboard in external applications, websites, or internal tools. This allows you to integrate Holistics dashboards into your product or portal while maintaining security and branding.
Learn more: Embedded analytics