🎨 Resize column width
You can now resize the width of table columns. This change is temporary, and doesn’t affect the default width of the column. You can also bring it back to default width by double-clicking on the resize hover

Follow us on X to stay up-to-date with new releases!
You can now resize the width of table columns. This change is temporary, and doesn’t affect the default width of the column. You can also bring it back to default width by double-clicking on the resize hover

Continuing our commitment to improving Holistics performance, we proudly introduce Job Performance Analytics Dashboard.
With Job Performance Analytics, you can:
To get access to the Closed Beta, sign up here: Job Performance Analytics Early Interest Form.
If you have any feedback or suggestions for us, we’d also love to hear. See Community Thread here.
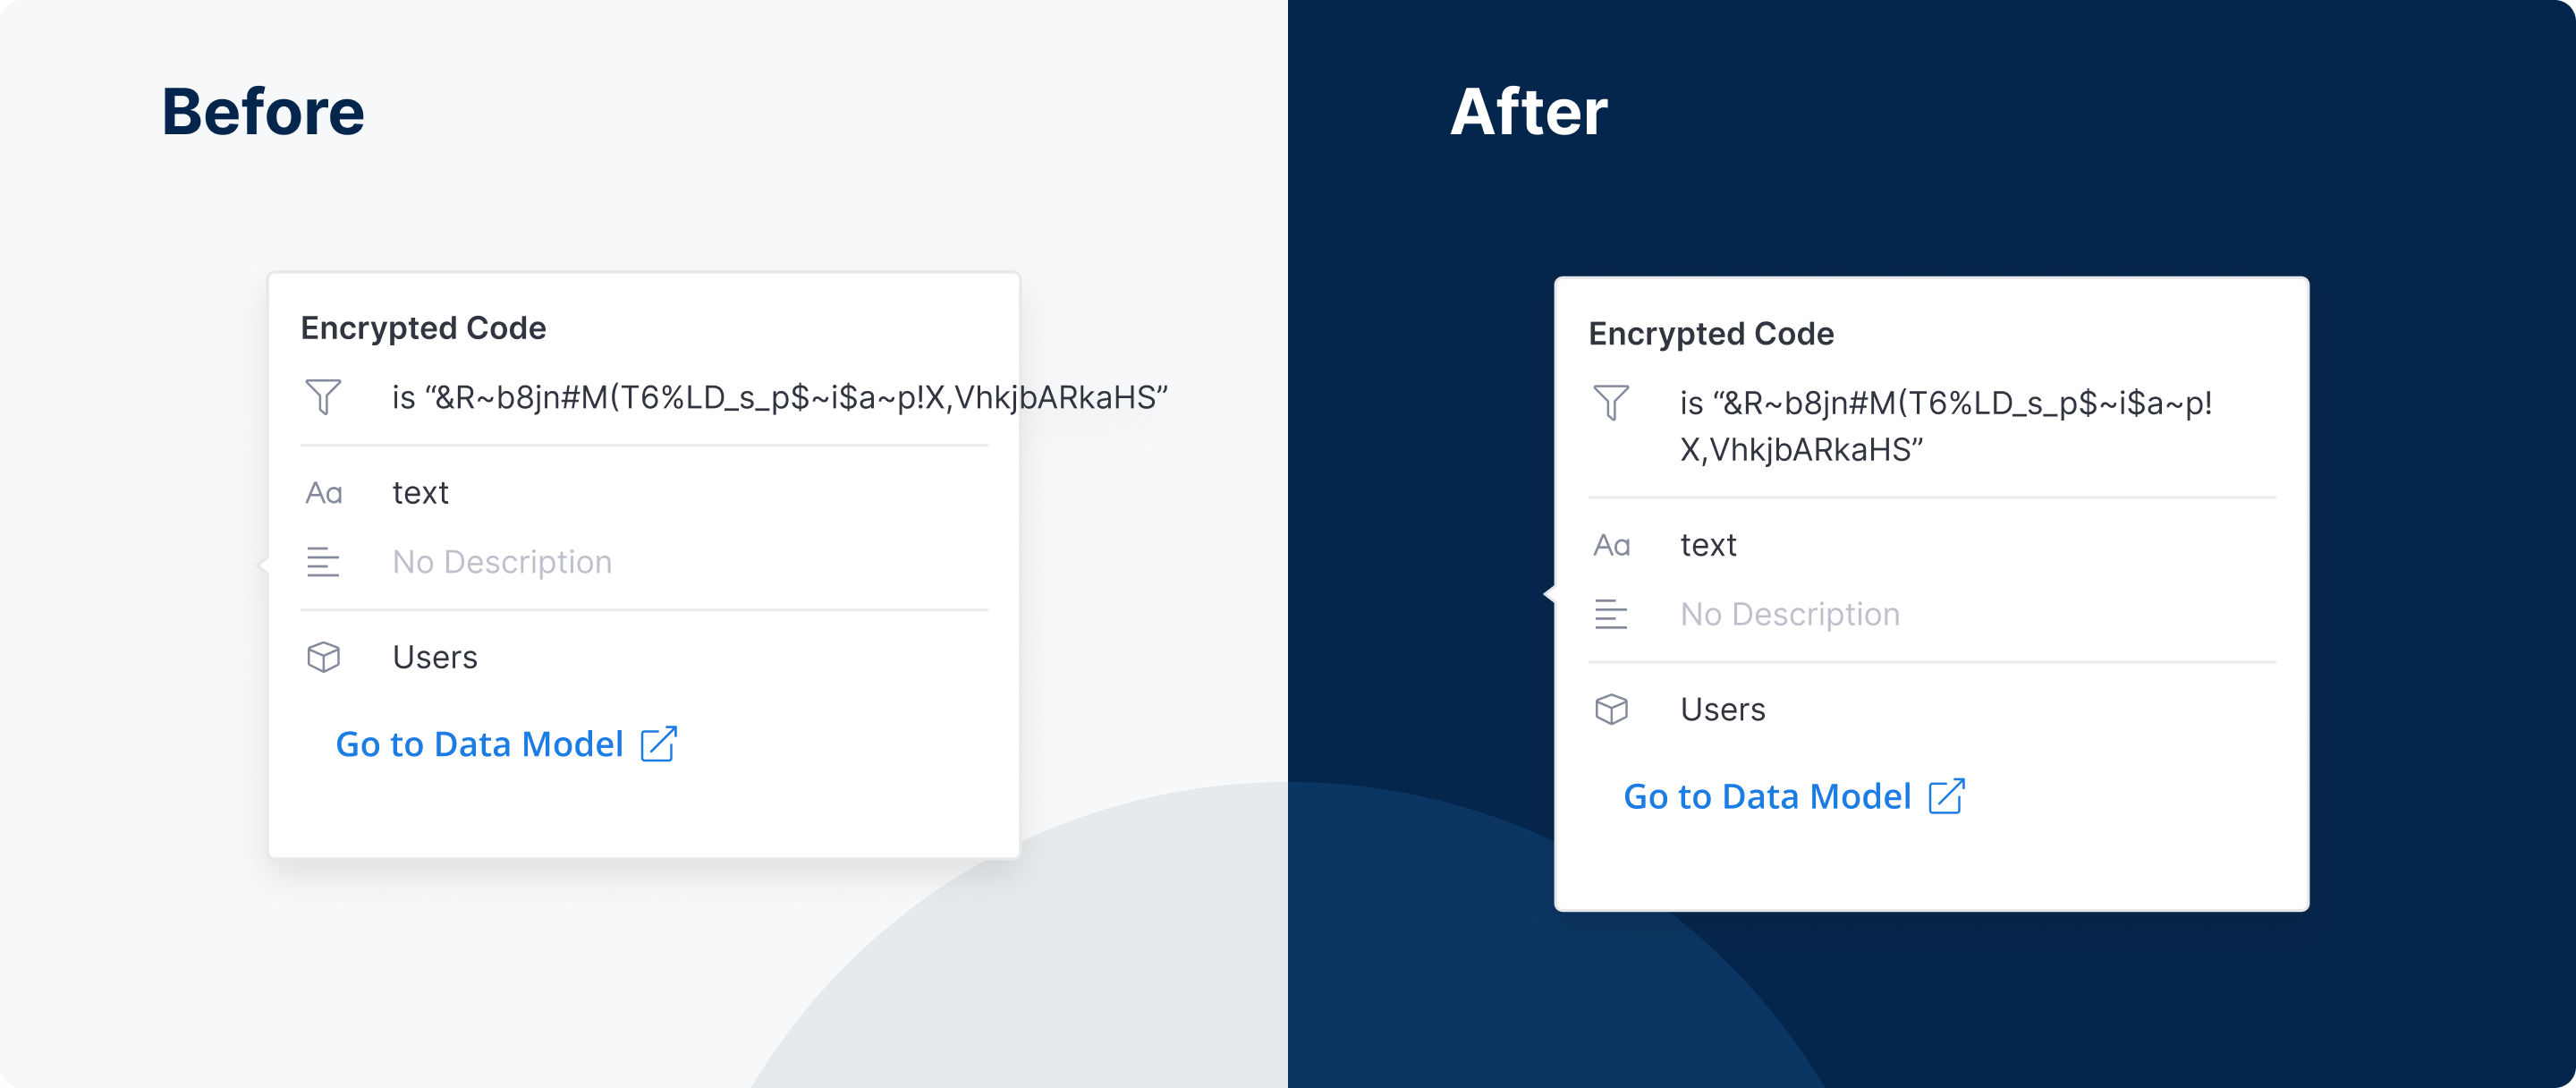
Overflow text in fields’ popover in the Visualizations panel now wraps correctly.

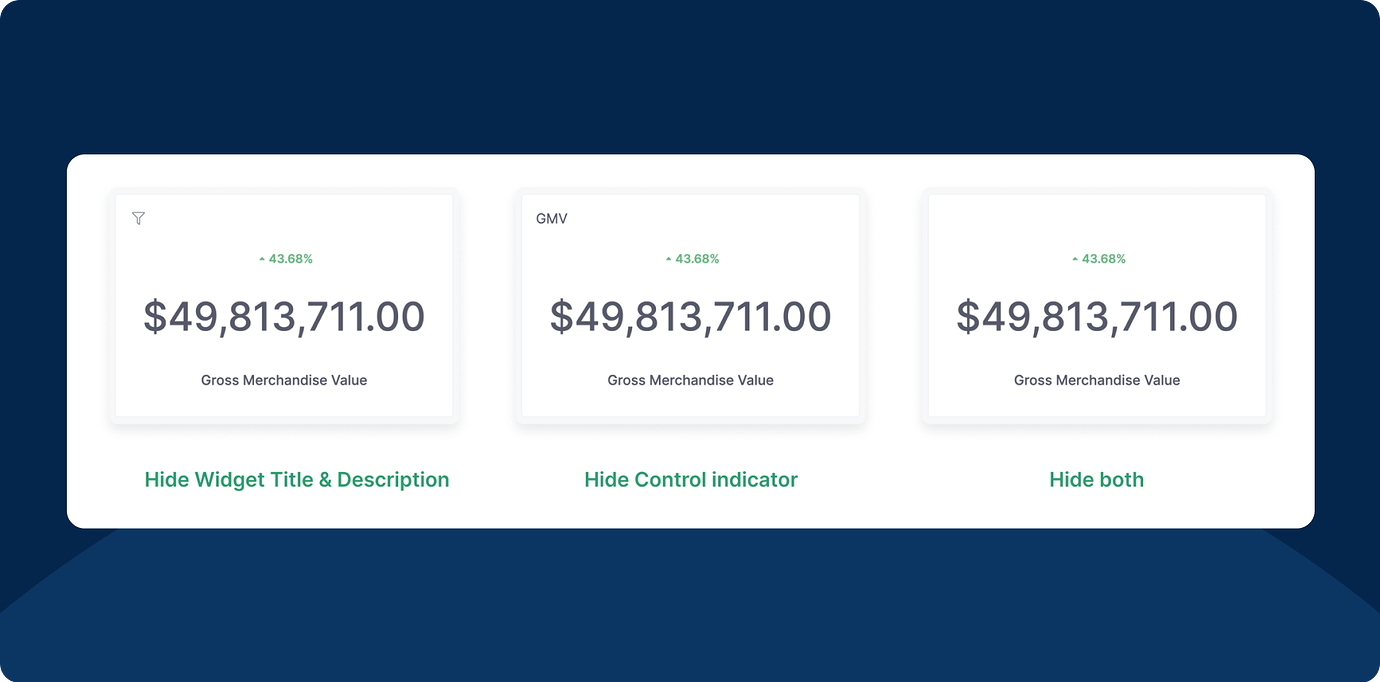
We added a new display setting in the Widget Preferences modal. You’re now able to hide some of the widget’s information.

We’ve recently released an improved version of our dashboard data drills, where you can add multiple date drills to your widgets. The results also persist in export and schedule.

Starting from now, you can monitor your Job Queues and Workers in real-time.
Head to our docs to learn more!

Are you concerned about Dashboards making unnecessary runs when users open it?
Check out how to Disable Dashboard Auto-run!

Our new table improvements have made rendering speed 3x faster compared to the previous version. In addition, we've made scrolling smoother, reduced popover load times, and more.
Check out this video to see the new Table in action:
Please note that this speed upgrade is all about visualization rendering. It doesn't affect query speed. Though, please rest assured we are working constantly to cover that, too!
P.S. We are working on similar upgrades for our Pivot table visualization, also. So please stay tuned!
We’re excited to announce that our integration with Databricks is now available, allowing you to combine the robust, scalable data processing power of Databricks with Holistics’ governed self-service platform.
For more information, check out our docs here.

Freeform layout is the most exciting feature in our upcoming Dashboard As-Code: You can drag-and-drop charts around to create space for context, give explanations, structure a business-friendly narrative, answer audience questions before they ask them, and build dashboards that spark stories, not boredom.
Better yet, everything on the dashboard is customizable using either a GUI or a Code-based Editor. The possibilities are abundant. You can turn it into a landing page, a Notion page, or any type of consumption interface that’s friendly to your viewers, and make it explorable with PoP or Data Drill, both of which were recently added to our Dashboards As Code.
How do you see this feature being useful to your team? If you have any feedback or suggestions for us, please share them here. We’re all ears.