Build a Dashboard with Multiple Similar Charts
Context
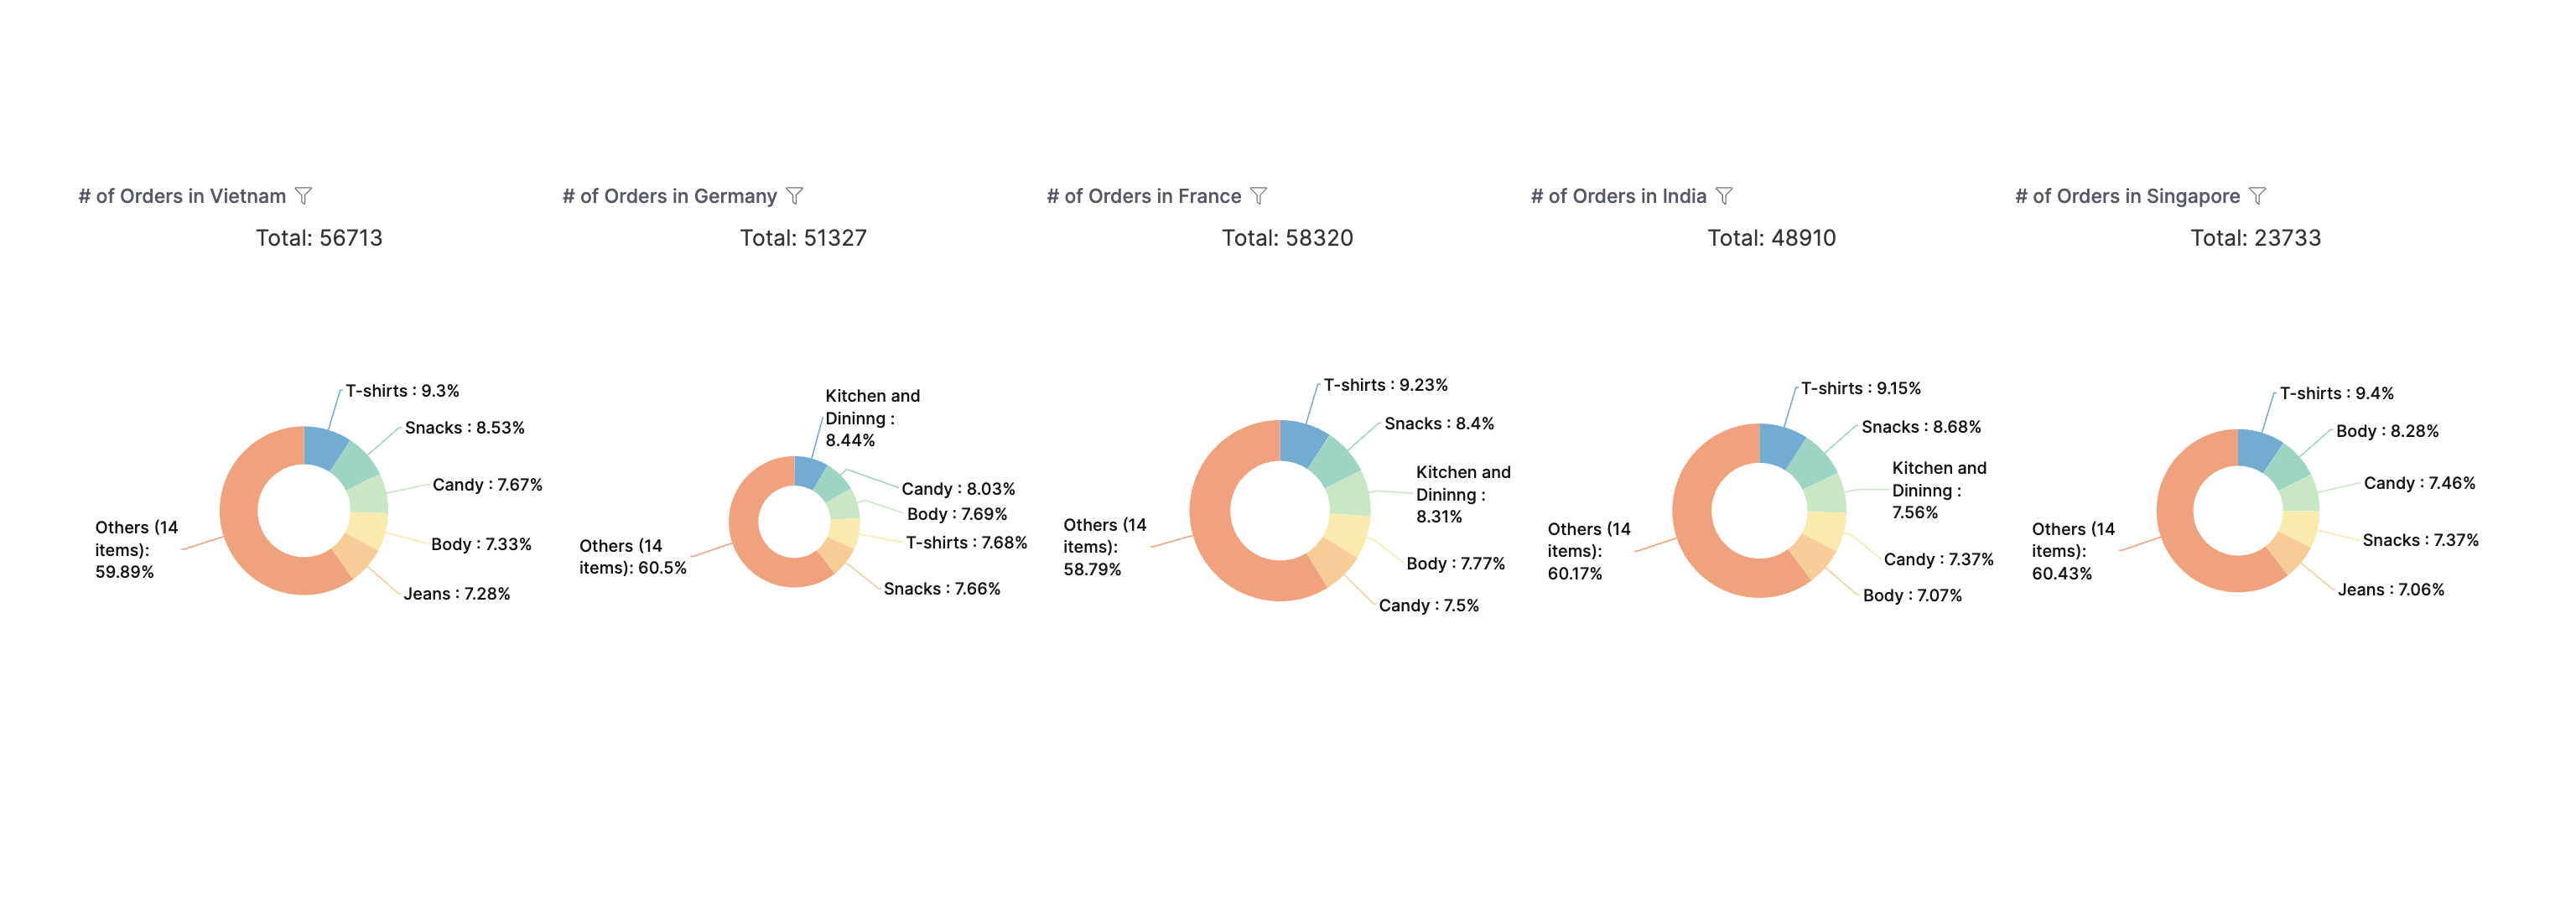
Let’s say you need to build a dashboard with 5 pie charts with the following requirements:
- Country-specific pie charts. The charts are all pie charts. Each chart shows data grouped by a specific country.
- Horizontally aligned pie charts. Charts must be arranged horizontally in a row.
- Different pie charts use different metrics. Some charts should display the number of total orders, other charts display the number of total orders received.
This documentation will show you how to build this dashboard in a reusable and maintainable way.
Build a chart once and use it everywhere
Requirements: Country-specific pie charts are pie charts. Each chart shows data grouped by a specific country.
If you duplicate code for each chart, you'd have to update all duplicated code when there are changes. Instead, a more reusable way is to define a pie chart once and use it everywhere. You can use AML Function to parameterize a pie chart to accept a country parameter.
// Define a function that takes in a string parameter `country`
Func get_order_pie_chart(country: String) {
  VizBlock {
  // Use `country` variable in the viz label
    label: '# of Orders in ${country}'
    viz: PieChart {
      filter {
        field: r(ecommerce_countries.name)
        operator: 'is'
        // Use `country` variable in the viz filter
        value: '${country}'
      }
      // ...
    }
  }
}

Dashboard demo_func_ecommerce {
  title: 'Ecommerce dashboard'
  block v9: get_order_pie('Vietnam')
  // Other charts that use different country
  block v10: get_order_pie('Germany')
  block v11: get_order_pie('France')
  block v12: get_order_pie('India')
  block v13: get_order_pie('Singapore')
  // ...
}
Auto-arrange charts horizontally
Requirements: Charts must be arranged horizontally in a row.
If you drag and drop charts manually, you'd spend quite some time obsessing over pixels to make sure they're perfectly aligned. A more automatic way is to calculate the arrangement automatically. You can use a combination of AML Constant and AML Function to compute positions given some parameters such as width, height, padding, the number of charts.
// Define the width and height of your Canvas Dashboard
const width = 2000
const height = 1000

// y-coordinate of our pie charts
const heightPos = 150

const heightPie = 400
// Declare the number of pie charts to automatically calculate the width of each chart
const numOfPie = 5
const widthPie = (width  - padding * numOfPie) / numOfPie

// Define the margin for each pie chart
const margin = 50
const padding = 50

// Define a function to calculate the positions for each visualization block based on their indices and information defined above
Func get_pos(index: Number) {
  pos(
    margin + widthPie * index + padding,
    heightPos,
    widthPie,
    heightPie
  )
}

// Other code ...

Dashboard demo_func_ecommerce {
  title: 'Ecommerce dashboard'
  view: CanvasLayout {
    label: 'View'
    // Use variables instead of hard-coded sizes
    width: width
    height: height
    // Call the same function with different indexes to automagically calculate the right positions
    block v9 { position: get_pos(0)}
    block v10 { position: get_pos(1)}
    block v11 { position: get_pos(2)}
    block v12 { position: get_pos(3)}
    block v13 { position: get_pos(4)}
  }

  block v9: get_order_pie('Vietnam')
  block v10: get_order_pie('Germany')
  block v11: get_order_pie('France')
  block v12: get_order_pie('India')
  block v13: get_order_pie('Singapore')

  // Other code ...
}
You can change the variables to change the arrangement of charts automatically.
Reuse a visualization block with different metrics
Requirements:. Some charts should display the number of total orders, other charts display the number of total orders received.
You can refactor the AML Function that produces a pie chart to accept another parameter that represents the data that the chart will use.
const total_orders_count = r(ecommerce_orders.total_orders_count)
const total_orders_delivered_count = r(ecommerce_orders.delivered_orders_count)

// This function is refactored to take in more parameters
Func get_order_pie(metric: FieldRef, country: String) {
  VizBlock {
    label: '# of Orders in ${country}'
    viz: PieChart {
      series {
        field {
          label: ' '
          // Use the variable here instead of hard-coding
          ref: metric
        }
      }
      // Other code ...
    }
  }
}


Dashboard demo_func_ecommerce {
  title: 'eCommerce func demo'
	// Call the function multiple times and pass different metrics as needed
  block v9: get_order_pie(total_orders_delivered_count, 'Vietnam')
  block v10: get_order_pie(total_orders_count, 'Germany')
  block v11: get_order_pie(total_orders_delivered_count, 'France')
  block v12: get_order_pie(total_orders_count, 'India')
  block v13: get_order_pie(total_orders_delivered_count, 'Singapore'
  // ...
}
If your charts use AQL expressions for custom calculations, you can still reuse those as followed:
Func kpiWidget(fieldRef: FieldRef, offset: Number) {
  VizBlock {
      label: 'KPI '
      viz: MetricKpi {
        dataset: aql_dataset
        // ...
        calculation calc {
          label: 'Value'
          formula:  @aql ${fieldRef.model}.${fieldRef.field}
                | relative_period(orders.created_at, interval(-${offset} month)) ;;
          calc_type: 'measure'
          data_type: 'number'
        }
    }
  }
}

Dashboard demo_func_ecommerce {
  block v9: kpiWidget(r(ecommerce_orders.total_orders_count), 2)
  block v10: kpiWidget(r(ecommerce_users.total_users_count), 2)
  block v11: kpiWidget(r(ecommerce_revenue.total_revenue), 2)

  // Other code ...
}