Build Reusable Dashboards for Multiple Clients
Introduction
Let's say that you're creating reports for multiple clients with the following requirements:
- Reusability. Reuse a standard dashboard template for all clients. Updating the template and all client dashboards should be updated at once.
- Client-specific customizations. Customize charts in a specific client dashboard without affecting other clients.
- Dynamic datasource. Each client has a separate data source that is used in their respective dashboards.
This documentation will show you how to build a reusable dashboard for all clients but can be customized for specific purposes.
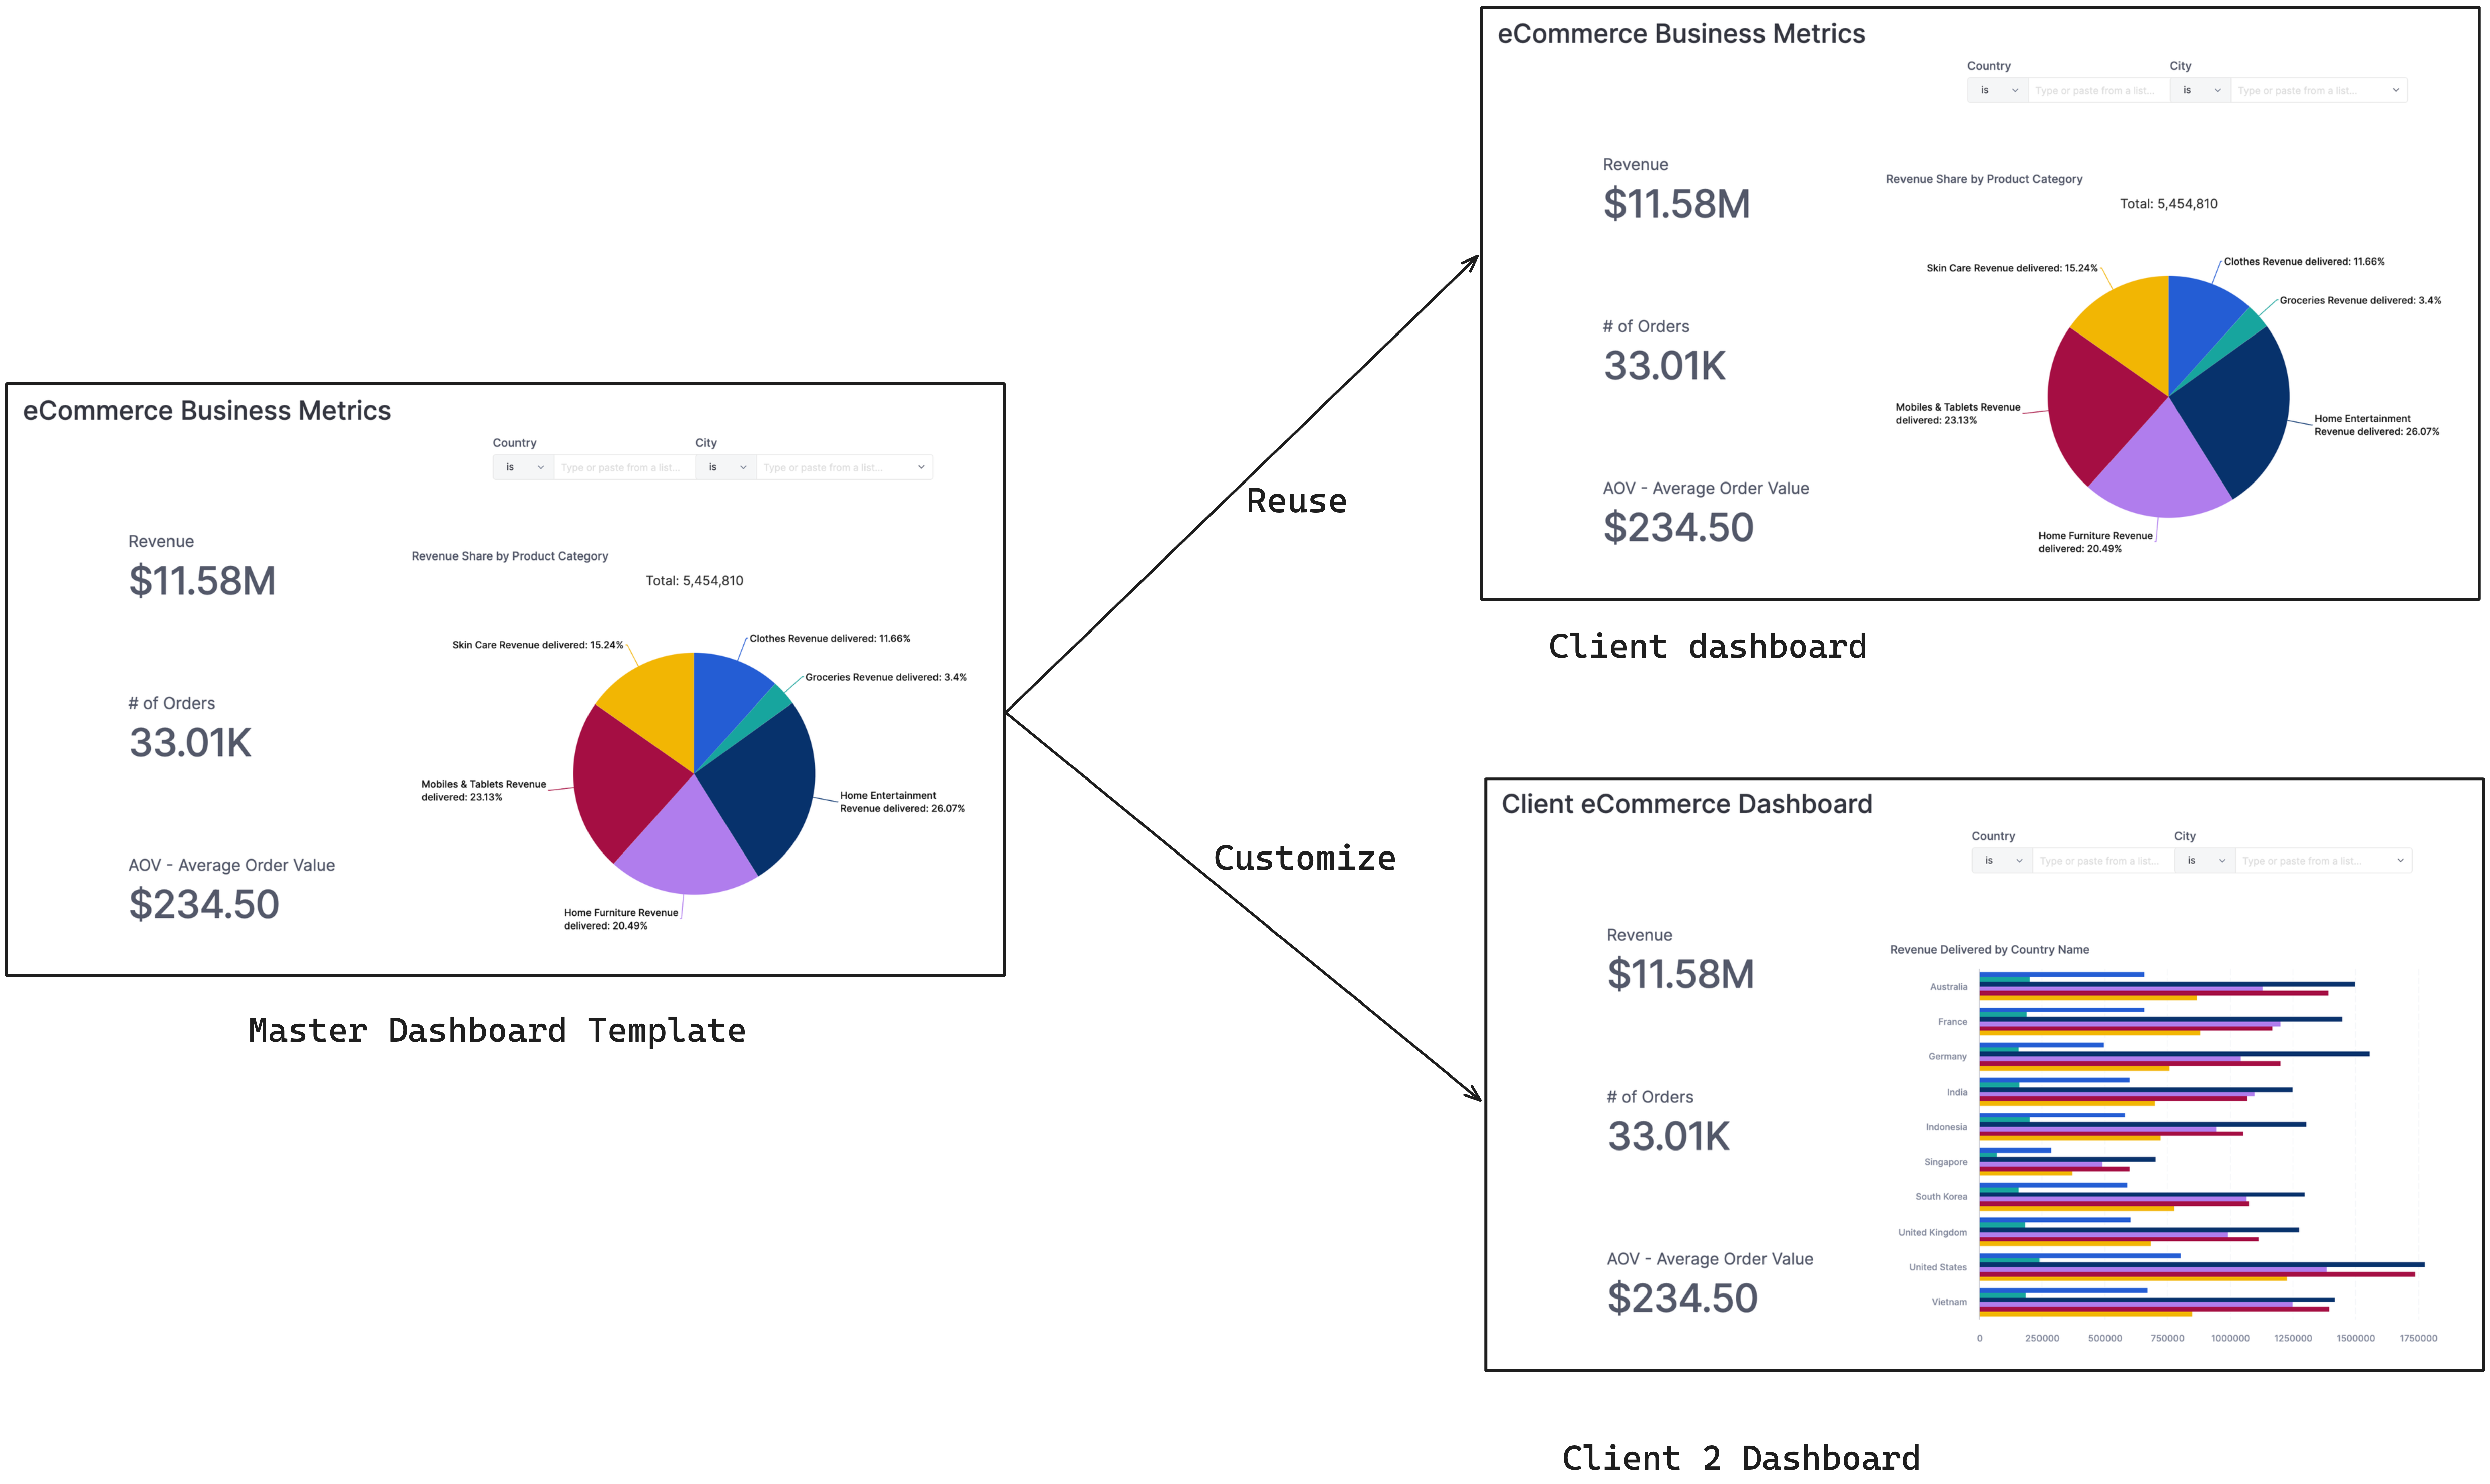
Step-by-step solution
- Define a master dashboard template with reusable chart components.
- Build client dashboards from master dashboard template. Updating the template should propagate changes to all client dashboards.
- Customize specific client dashboards. Point each client dashboard to the respective client's data source and add new charts to the client dashboard.
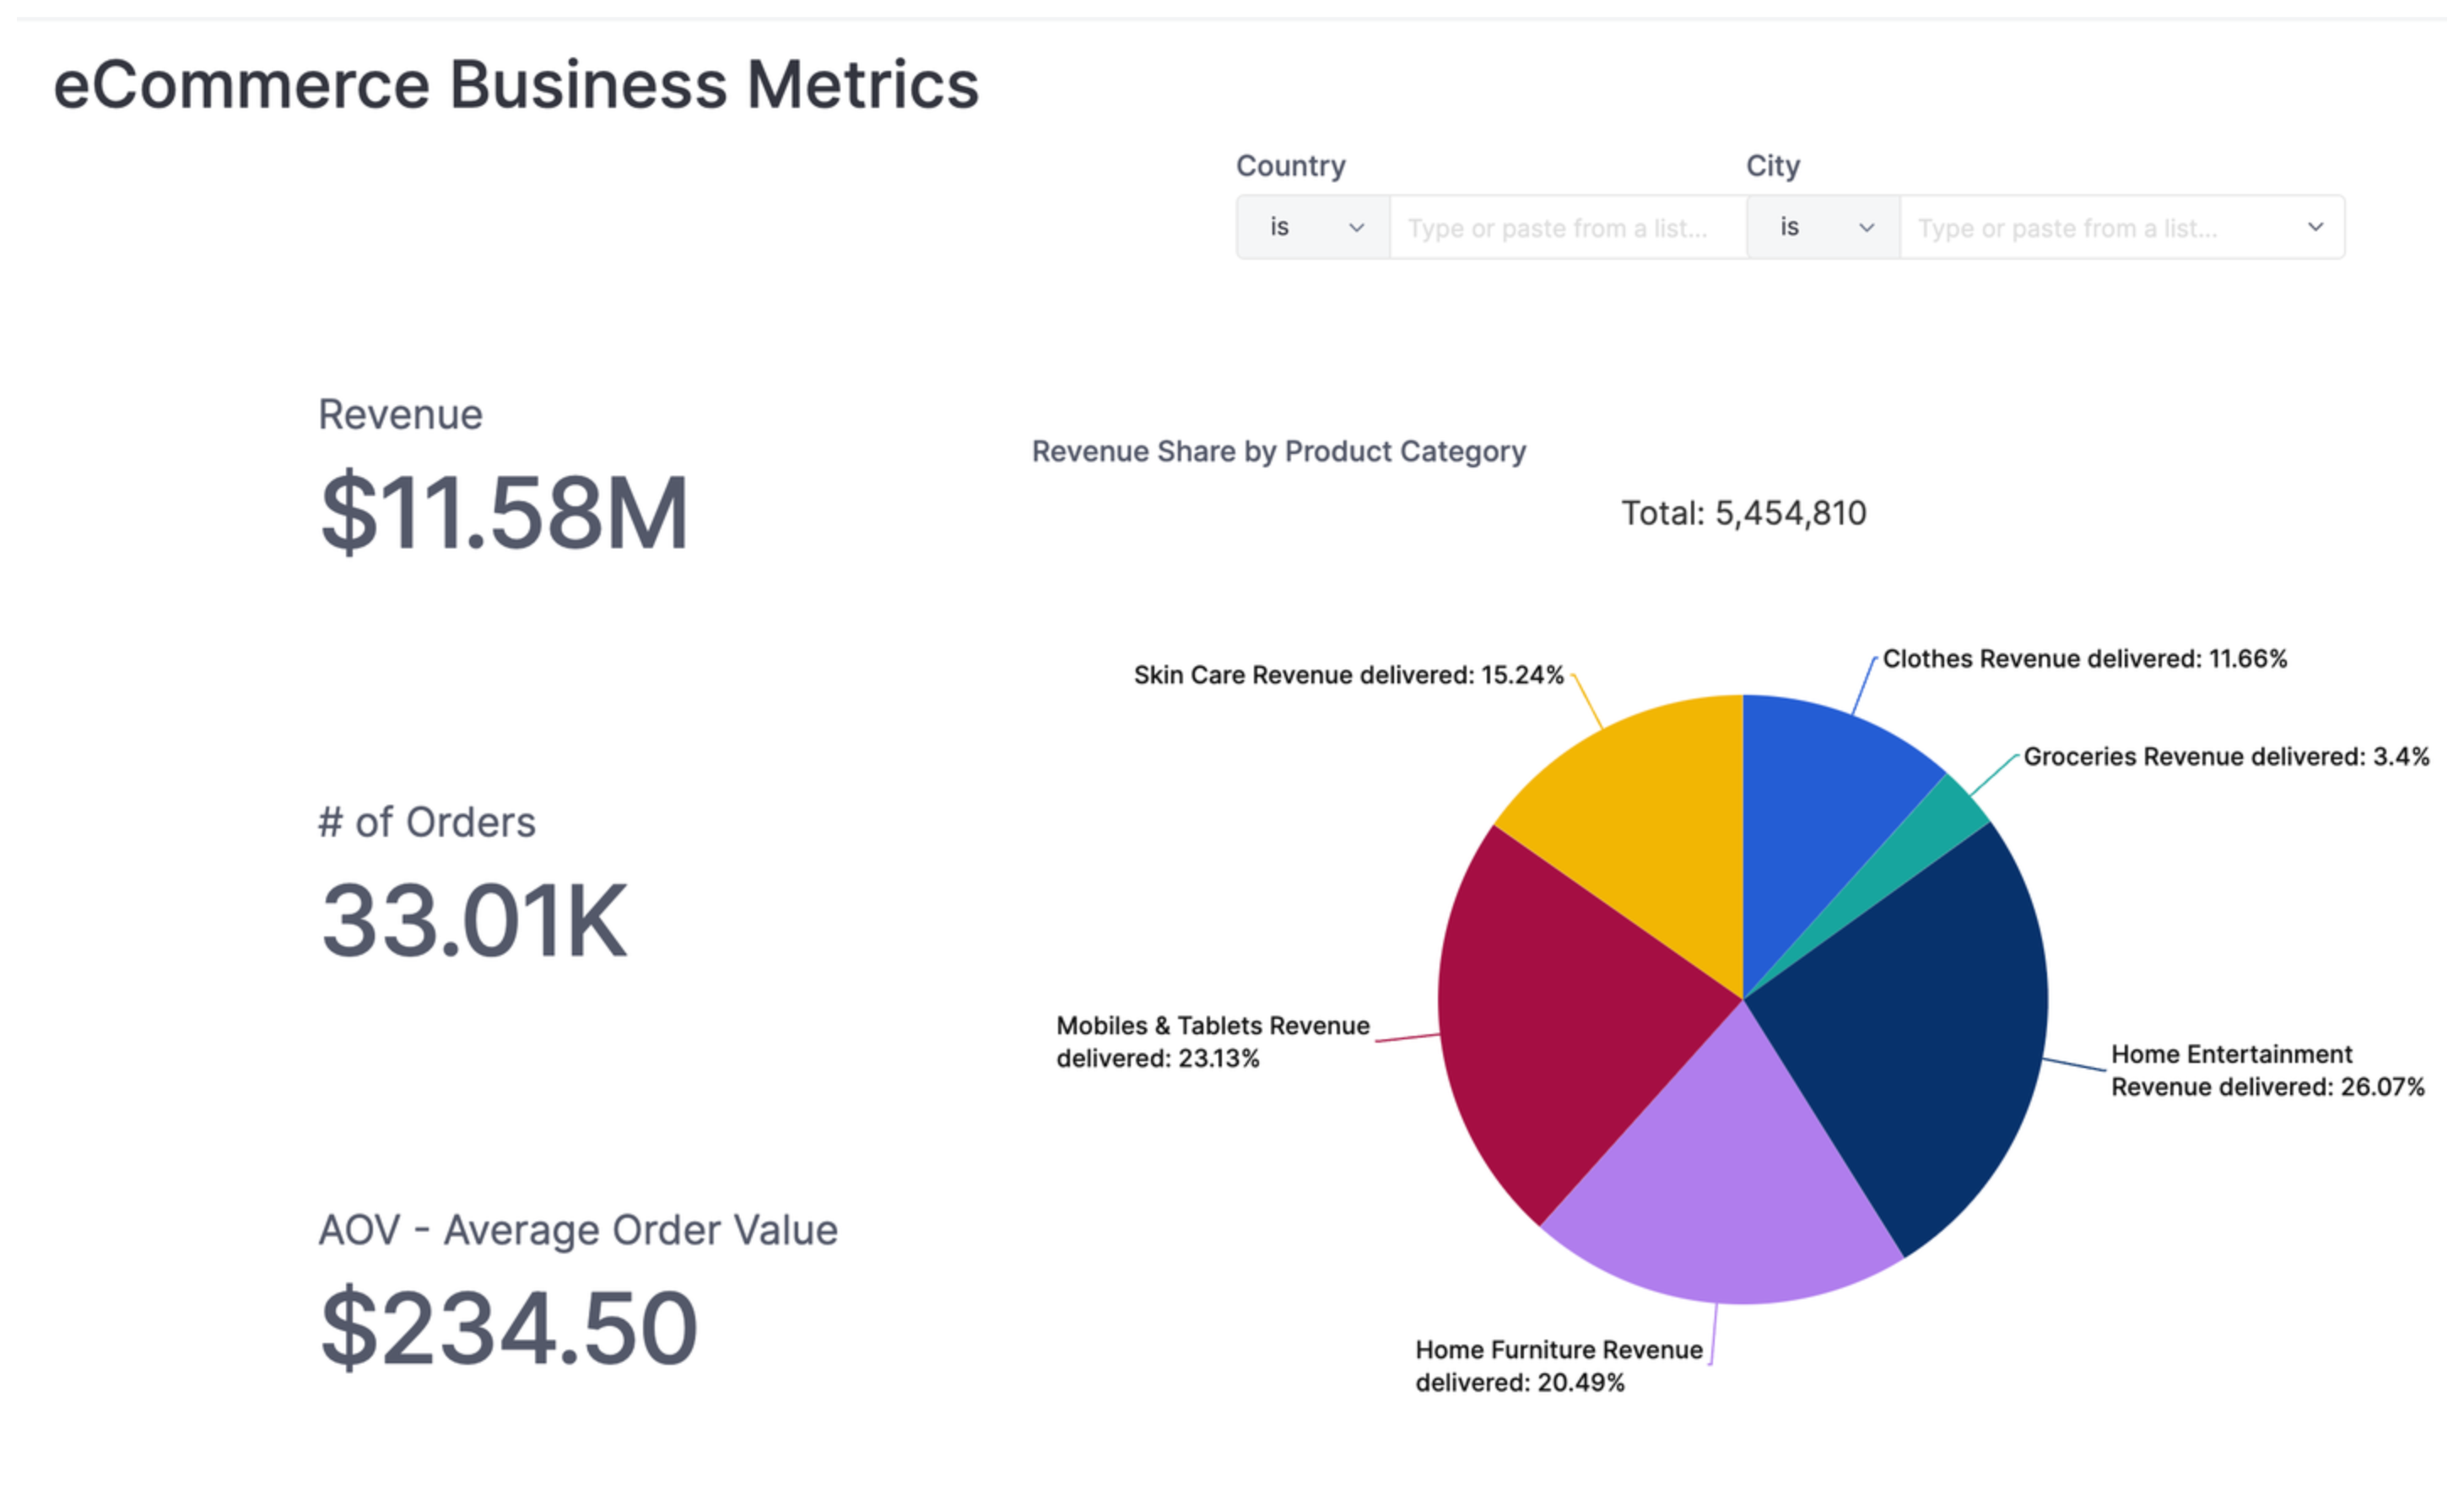
Define a master dashboard template
Create a master dashboard template as follows:
// In master_template.page.aml

// Define master dashboard template
Dashboard master_dashboard_template {
  title: 'eCommerce Business Metrics'
  block v1: VizBlock {
    viz: PieChart {
      // A default dataset. Can refer to client's dataset later
      dataset: default_dataset
      //...
      settings {
        // This draws the chart as a donut
        display_as_donut: false
        // ...
      }
    }
  }
  // ...
}
Build client dashboards from the master dashboard template
Once you define a dashboard template, use AML Extend to build client dashboards. Extending a dashboard lets you inherit all of its properties, including titles, charts, filters, and settings.
// In client_dashboard.page.aml
// Extend the master dashboard template into a client dashboard
Dashboard client_dashboard = master_dashboard_template.extend({})
The client dashboard will look the same as the master dashboard template.
Let's edit the pie chart in the master dashboard template so that it shows a donut instead of a pie.
// In master_template.page.aml
Dashboard master_dashboard_template {
  title: 'eCommerce Business Metrics'
  block v1: VizBlock {
    viz: PieChart {
      // A default dataset. Can refer to the client's dataset later
      dataset: default_dataset
      //...
      settings {
        // Changed this to `true` to display a donut pie
        display_as_donut: true
        // ...
      }
    }
  }
  // ...
}
You should see changes being reflected in the client dashboard.
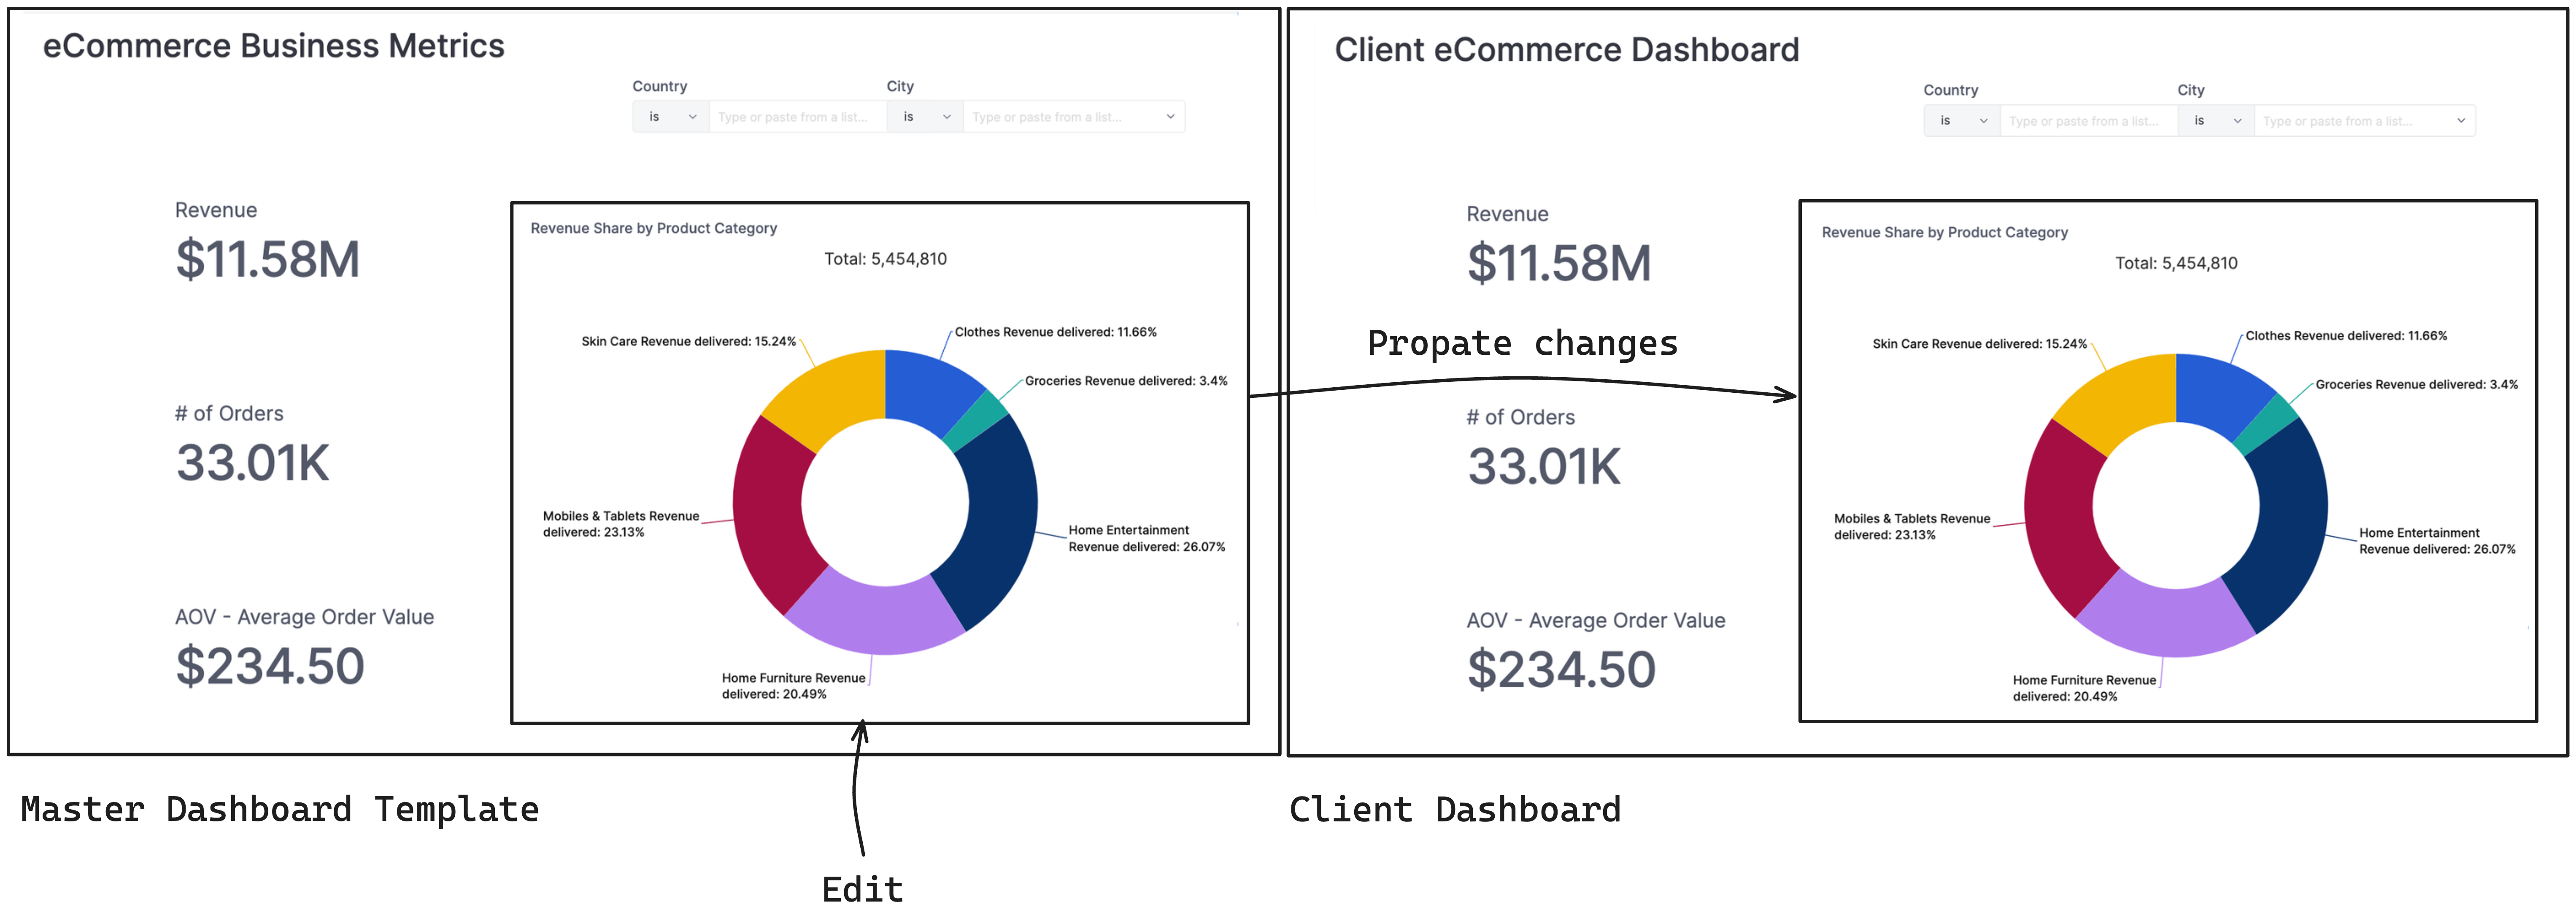
By extending the master dashboard template, you can add/edit the template and have changes propagated to all client dashboards automatically.
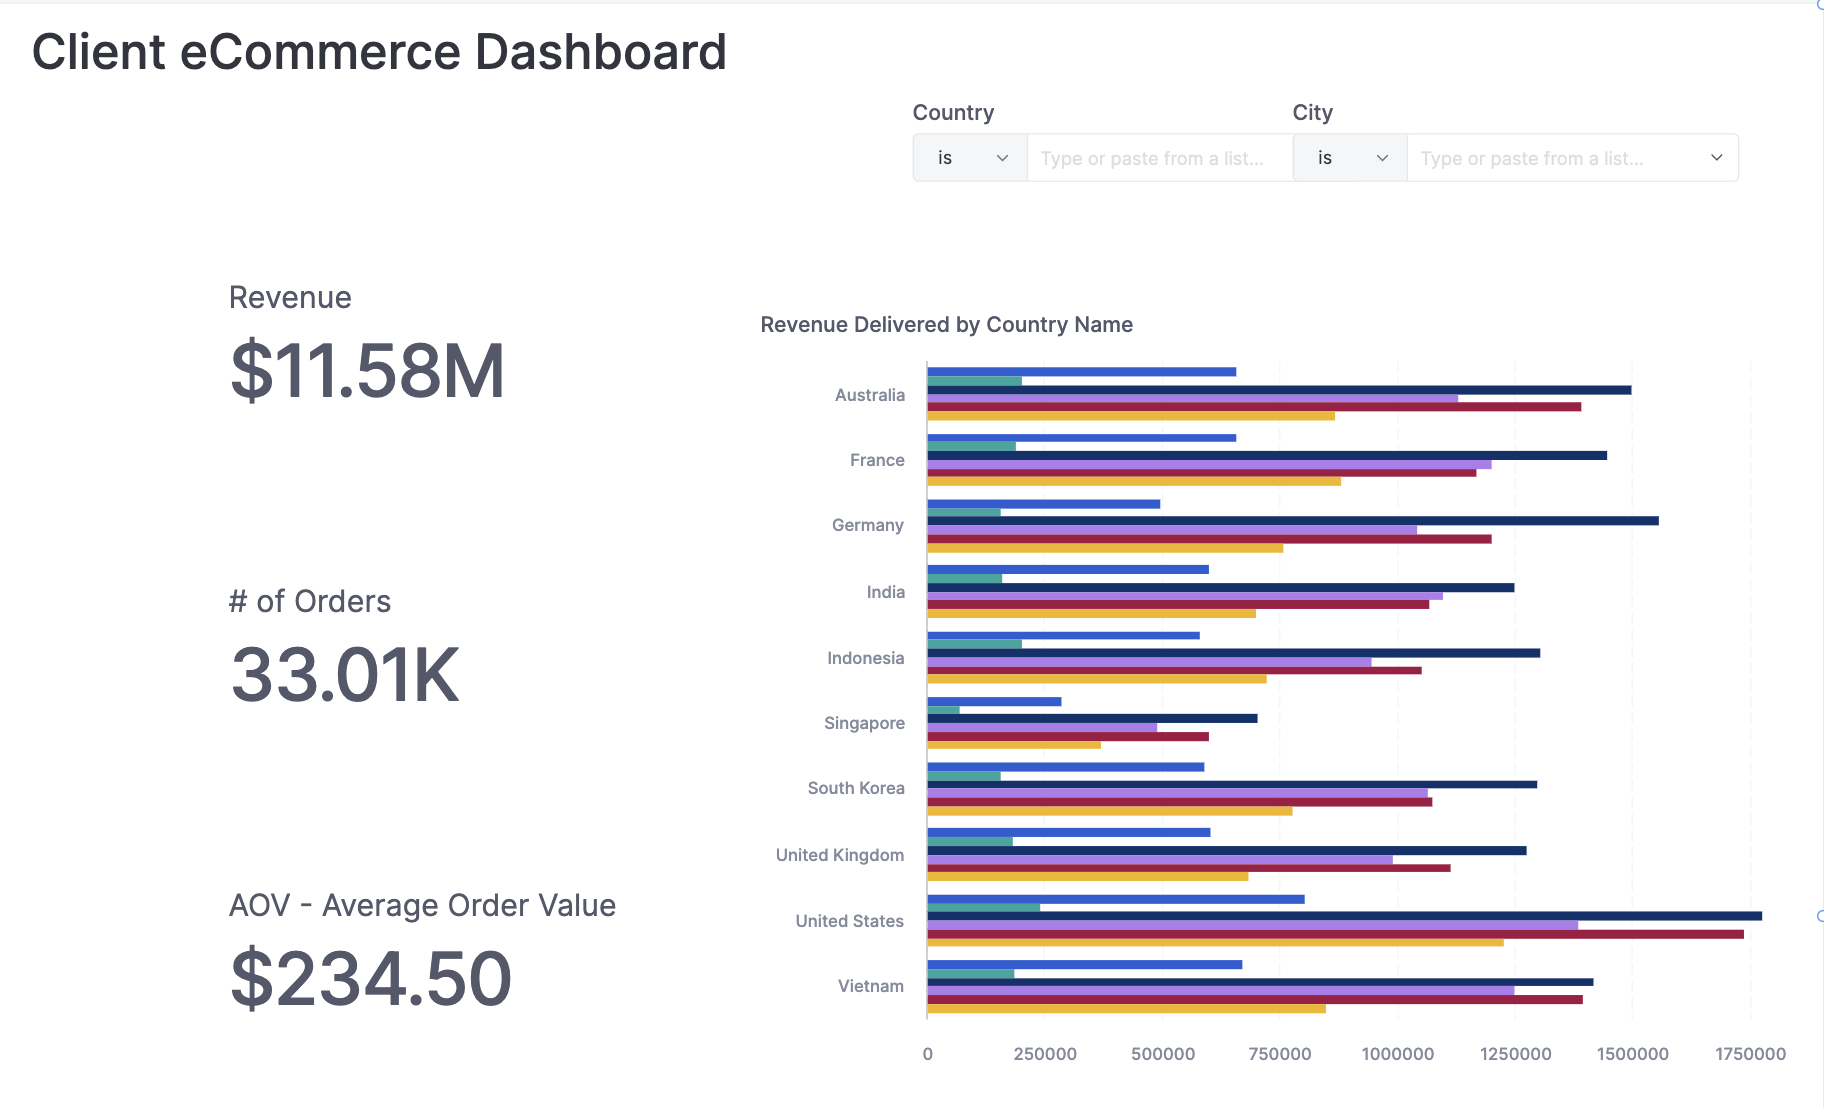
Customize specific client dashboards
You can also use AML Extend to override a chart in the dashboard template. Define a new bar chart and use this instead and of the pie chart.
// In client_dashboard.page.aml
Dashboard client_dashboard = master_dashboard_template.extend({
// Define a bar chart for revenue share instead of a pie chart
  block v1: BarChart {
      dataset: default_dataset
      // ...
    }
  }
})
Now the client dashboard will use the bar chart instead of the pie chart. This doesn't affect the dashboard template or any other client dashboards you may have.
Finally, you can use AML Function that accepts a dataset parameter and returns a pie chart. This will allow you to dynamically point any chart to a specific client's data source.
// In client_dashboard.page.aml
// Refactor this function to accept a dataset param
Func getRevenueShareBarChart(dataset_param) {
  VizBlock {
    viz: BarChart {
      // Use the dataset param instead of hard-coded value
      dataset: dataset_param
      // ...
    }
  }
}

Dashboard client_dashboard = master_dashboard_template.extend({
  // Call the function with the client's actual data source
  block v1: getRevenueShareBarChart(client_dataset);
})