Create Quick Dashboard
- Holistics recommends using Canvas Dashboards.
- Holistics Dashboard 3.0 is now called Quick dashboard. See this guide on how to convert quick dashboards into Canvas Dashboards.
Introduction
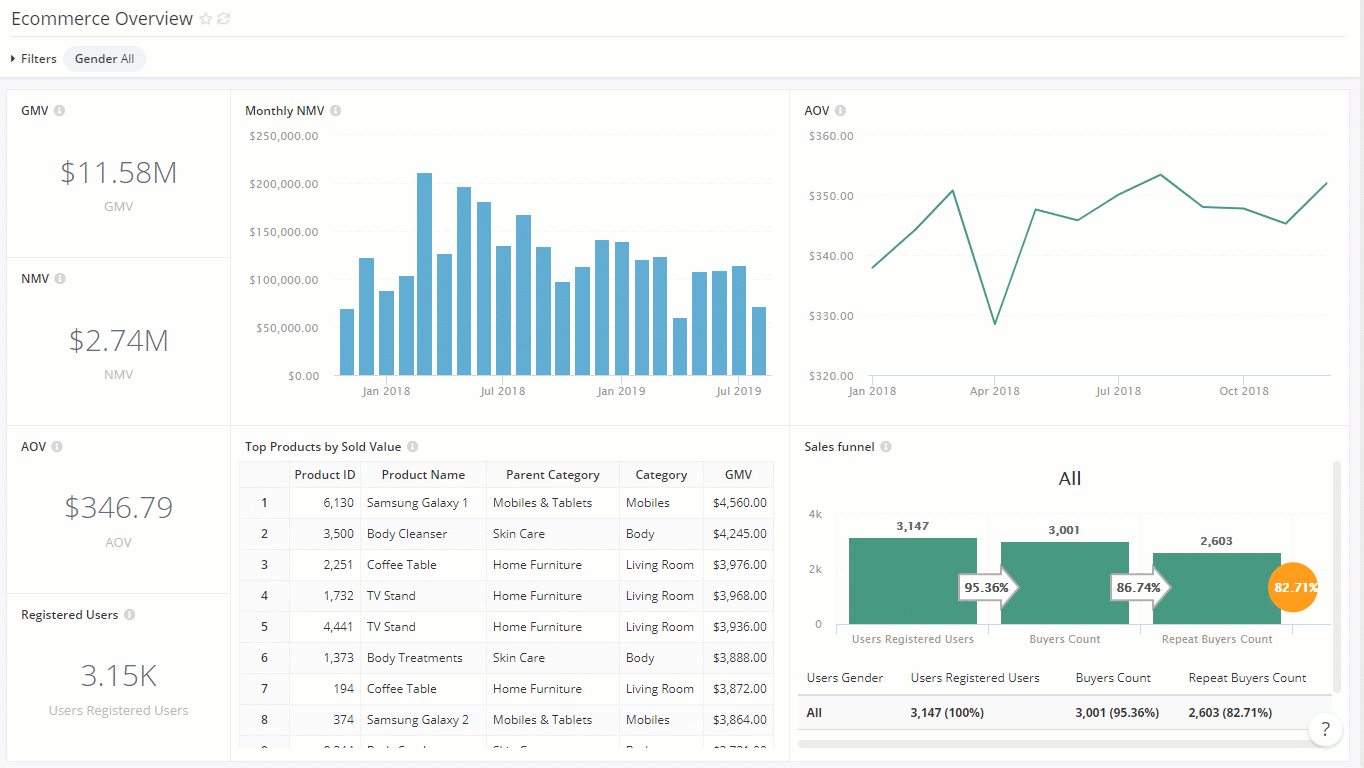
In Holistics, Quick Dashboard is a collection of widgets that help you tell a story, or paint a big picture of your organization. This is where you save your ad-hoc data exploration into something permanent and deliver continuous values to your end users.
Create a dashboard
How-to
On the Reporting page, you can create a new quick dashboard from several places:
- Top navigation bar
- Sidebar
- Inside a folder

- Step 1: Click on the (+) icon at the top navigation bar.
- Step 2: Select the New Quick Dashboard option, and the dashboard will be in the outermost folder of the "Reports & Dashboards” section in the sidebar.

- Step 1: Hover over your folder.
- Step 2: Click on the (+) icon.
- Step 3: Select the Add Quick Dashboard option, and the dashboard will be created inside that folder.

- Step 1: Double-click on your folders to explore at a deeper level.
- Step 2: Click on the (+) Create button at the top right corner.
- Step 3: Select the Add Quick Dashboard option, and the dashboard will be created inside that folder.
You can also create a dashboard when exploring dataset. For more details, refer to Create dashboard from dataset exploration
Editor tour

- Main Editor: The main area to build the dashboard and apply interactive controls.
- Settings & Deliver data: Edit dashboard time zones, cache, other preferences, and deliver dashboard with export and shareable link.
- Generate Canvas Dashboard: Create another version in Canvas Dashboard. You will now have two dashboards: the original Quick Dashboard and the new Canvas Dashboard.
Add dashboard widgets
How-to
After creating a dashboard, you can start adding widgets directly from the dashboard page, or save your data exploration results into the dashboard.
- From Dashboard View
- From Dataset Exploration
Go to Add -> Add New Report for a report widget or Add Text for a text widget in the dashboard view. Choose a dataset, and use the drag-and-drop UI to explore and create visualizations.

While exploring data, click Save and select an existing dashboard to save your exploration result to it.

Widget types
In Holistics's dashboard, there are two types of widgets: Report widget and Text widget.
Report widgets are used to visualize your data. Since Report widgets are backed by datasets, you can freely explore the underlying data:
On the other hand, Text widgets are used to provide additional instructions, context, warnings... directly in your dashboard. The widget supports Markdown, which should serve your most common formatting requirements.
For example, adding dashboard section header:

Customize widgets
Resize Widget:
To resize a report widget, hover your cursor at any corner of the widget until it becomes . Drag to expand or minimize the widget.
Customize Display Preferences:
You can tweak the display of the widgets for a cleaner look by clicking on the "..." on the top right corner of the widget and select Widget Preferences:

This is how the widgets look like when toggling between options:

Add Dashboard Filters
To add filters to your dashboard:
- Click on Add filter icon on the top right corner. The Add Filter screen will appear.
- Enter the name of your filter, and choose from the five types of filters (Field, Date, Text, Number, True/False).
- Enter a default value for your filter if necessary.
- Toggle on the widgets that you want to control, and map the filter to a widget's fields.Notes:
- You can only map the filter to fields of the same data type.
- You can map the filter to any field available in the widget's dataset, not just the ones you used to create the visualization.
