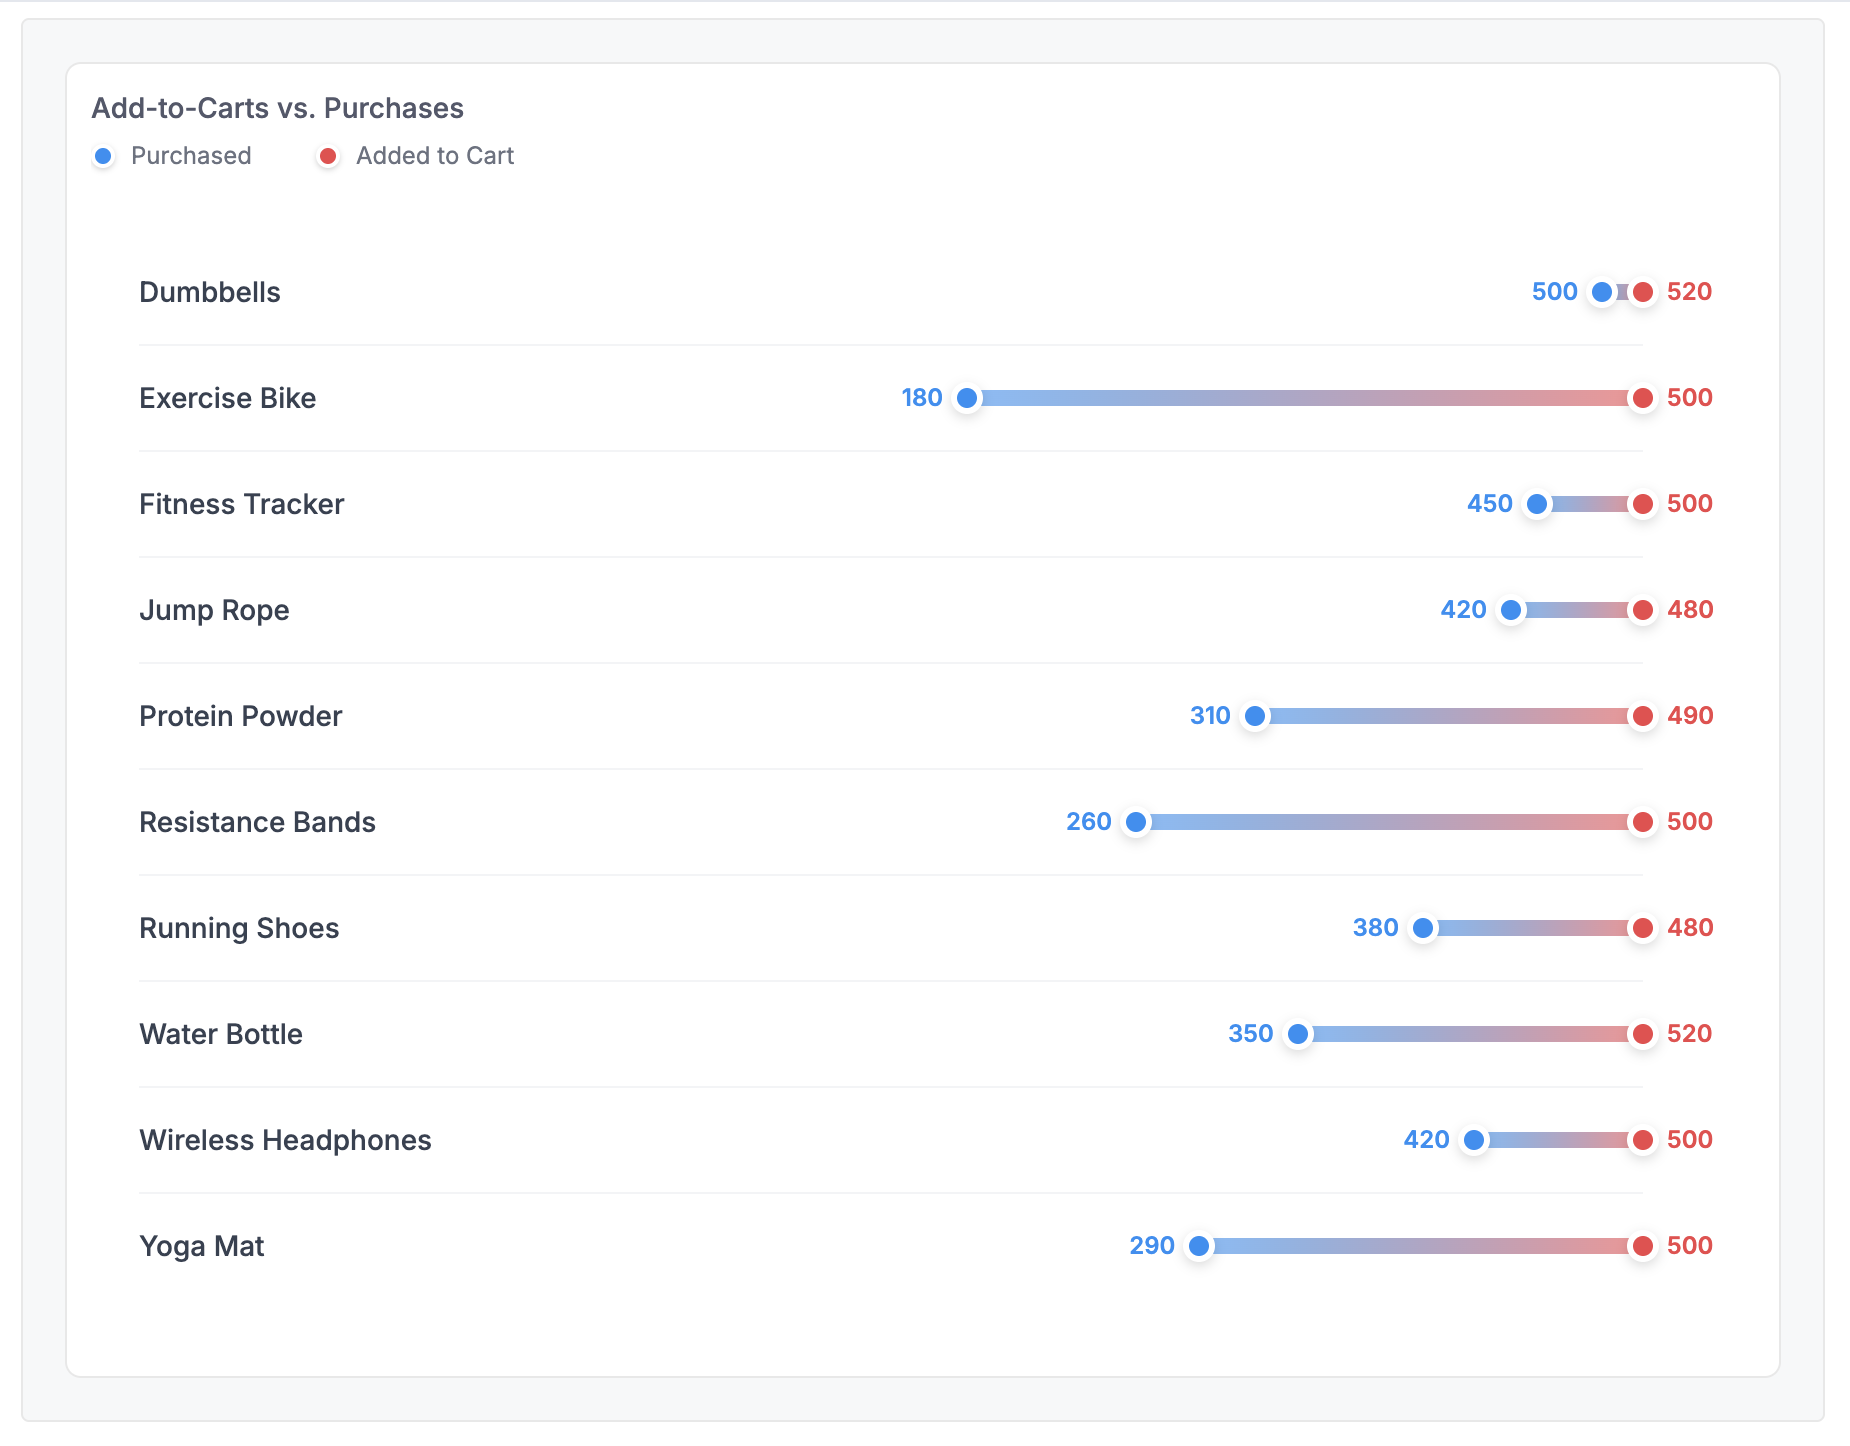
Dumbbell Chart
A custom visualization comparing two related metrics side-by-side, perfect for showing gaps between values like cart additions vs. purchases.
Best for: Funnel analysis, before/after comparisons, gap visualization
Key techniques: map(rows) loop, percentage calculations for positioning, CSS-based chart rendering
Template Code
<style>
  .dumbbell-container {
    padding: 1.5rem;
    max-width: 800px;
  }

  .dumbbell-row {
    display: grid;
    grid-template-columns: 200px 1fr;
    gap: 1.5rem;
    align-items: center;
    padding: 1rem 0;
    border-bottom: 1px solid #F3F4F6;
  }

  .dumbbell-row:last-child {
    border-bottom: none;
  }

  .dumbbell-label {
    font-size: 0.875rem;
    font-weight: 500;
    color: #374151;
  }

  .dumbbell-plot-area {
    position: relative;
    height: 20px;
    display: flex;
    align-items: center;
  }

  .dumbbell-bar-container {
    position: relative;
    width: 100%;
    height: 100%;
  }

  .dumbbell-line {
    position: absolute;
    height: 8px;
    background: linear-gradient(to right, #0891F2, #F1434B);
    border-radius: 4px;
    opacity: 0.6;
    top: 50%;
    transform: translateY(-50%);
  }

  .dumbbell-dot {
    position: absolute;
    width: 16px;
    height: 16px;
    border-radius: 50%;
    border: 3px solid white;
    box-shadow: 0 2px 6px rgba(0, 0, 0, 0.15);
    top: 50%;
    transform: translate(-50%, -50%);
    z-index: 2;
  }

  .dumbbell-dot.start {
    background-color: #0891F2;
  }

  .dumbbell-dot.end {
    background-color: #F1434B;
  }

  .dumbbell-value {
    position: absolute;
    font-size: 0.75rem;
    font-weight: 600;
    white-space: nowrap;
    top: 50%;
    transform: translateY(-50%);
  }

  .dumbbell-value.start {
    color: #0891F2;
    transform: translate(calc(-100% - 12px), -50%);
  }

  .dumbbell-value.end {
    color: #F1434B;
    transform: translate(12px, -50%);
  }

  .dumbbell-legend {
    display: flex;
    gap: 2rem;
    padding: 0 0 0.5rem 0;
    font-size: 0.75rem;
    color: #6B7280;
  }

  .legend-item {
    display: flex;
    align-items: center;
    gap: 0.5rem;
  }

  .legend-dot {
    width: 12px;
    height: 12px;
    border-radius: 50%;
    border: 2px solid white;
    box-shadow: 0 1px 3px rgba(0, 0, 0, 0.2);
  }

  .legend-dot.start {
    background-color: #0891F2;
  }

  .legend-dot.end {
    background-color: #F1434B;
  }

  @media (max-width: 768px) {
    .dumbbell-row {
      grid-template-columns: 1fr;
      gap: 0.5rem;
    }

    .dumbbell-label {
      font-weight: 600;
      padding-bottom: 0.5rem;
    }

    .dumbbell-plot-area {
      height: 60px;
    }
  }
</style>

<div class="dumbbell-legend">
  <div class="legend-item">
    <span class="legend-dot start"></span>
    <span>Purchased</span>
  </div>
  <div class="legend-item">
    <span class="legend-dot end"></span>
    <span>Added to Cart</span>
  </div>
</div>

<div class="dumbbell-container">
{% map(rows) %}
  <div class="dumbbell-row">
    <div class="dumbbell-label">{{ `Product name` }}</div>
    <div class="dumbbell-plot-area">
      <div class="dumbbell-bar-container">
        <div class="dumbbell-line" style="left: {{ `Start Percent`.raw }}%; width: {{ `Bar Width`.raw }}%;"></div>
        <div class="dumbbell-dot start" style="left: {{ `Start Percent`.raw }}%;"></div>
        <div class="dumbbell-value start" style="left: {{ `Start Percent`.raw }}%;">{{ `Purchased` }}</div>
        <div class="dumbbell-dot end" style="left: {{ `End Percent`.raw }}%;"></div>
        <div class="dumbbell-value end" style="left: {{ `End Percent`.raw }}%;">{{ `Added to cart` }}</div>
      </div>
    </div>
  </div>
{% end %}
</div>
Required Data Fields
| Field | Type | Description |
|---|---|---|
Product name | Dimension | Row label |
Purchased | Measure | Start value (left dot) |
Added to cart | Measure | End value (right dot) |
Start Percent | Calculation | Position of start dot (0-100) |
End Percent | Calculation | Position of end dot (0-100) |
Bar Width | Calculation | Width of connecting bar |
Sample Data
Import this data into Holistics to use: sample-data-dumbbell.csv
Product name,Added to cart,Purchased,Start Percent,End Percent,Bar Width
Protein Powder,490,310,63.27,100,36.73
Dumbbells,520,500,96.15,100,3.85
Wireless Headphones,500,420,84.00,100,16.00
Water Bottle,520,350,67.31,100,32.69
Running Shoes,480,380,79.17,100,20.83
Resistance Bands,500,260,52.00,100,48.00
Yoga Mat,500,290,58.00,100,42.00
Jump Rope,480,420,87.50,100,12.50
Fitness Tracker,500,450,90.00,100,10.00
Exercise Bike,500,180,36.00,100,64.00
The percentage fields are calculated as: Start Percent = (Purchased / Added to cart) * 100, End Percent = 100, Bar Width = End Percent - Start Percent.
Customization Tips
- Change the gradient colors in
.dumbbell-lineto match your brand - Adjust dot colors (
.dumbbell-dot.start,.dumbbell-dot.end) for different comparisons - Modify the legend text to match your metric names
- The percentage calculations should normalize your values to a 0-100 scale