Dashboard overview
Introduction
Dashboards help you create interactive data presentations that let you tell compelling stories with your data or paint a bigger picture of your organization.
The dashboard is made up of modular units called Building blocks arranged inside the Dashboard editor. Think of them like Lego blocks, and your editor is the base board, with these blocks sitting on top.

Type of Dashboards
There are two types of dashboards in Holistics:
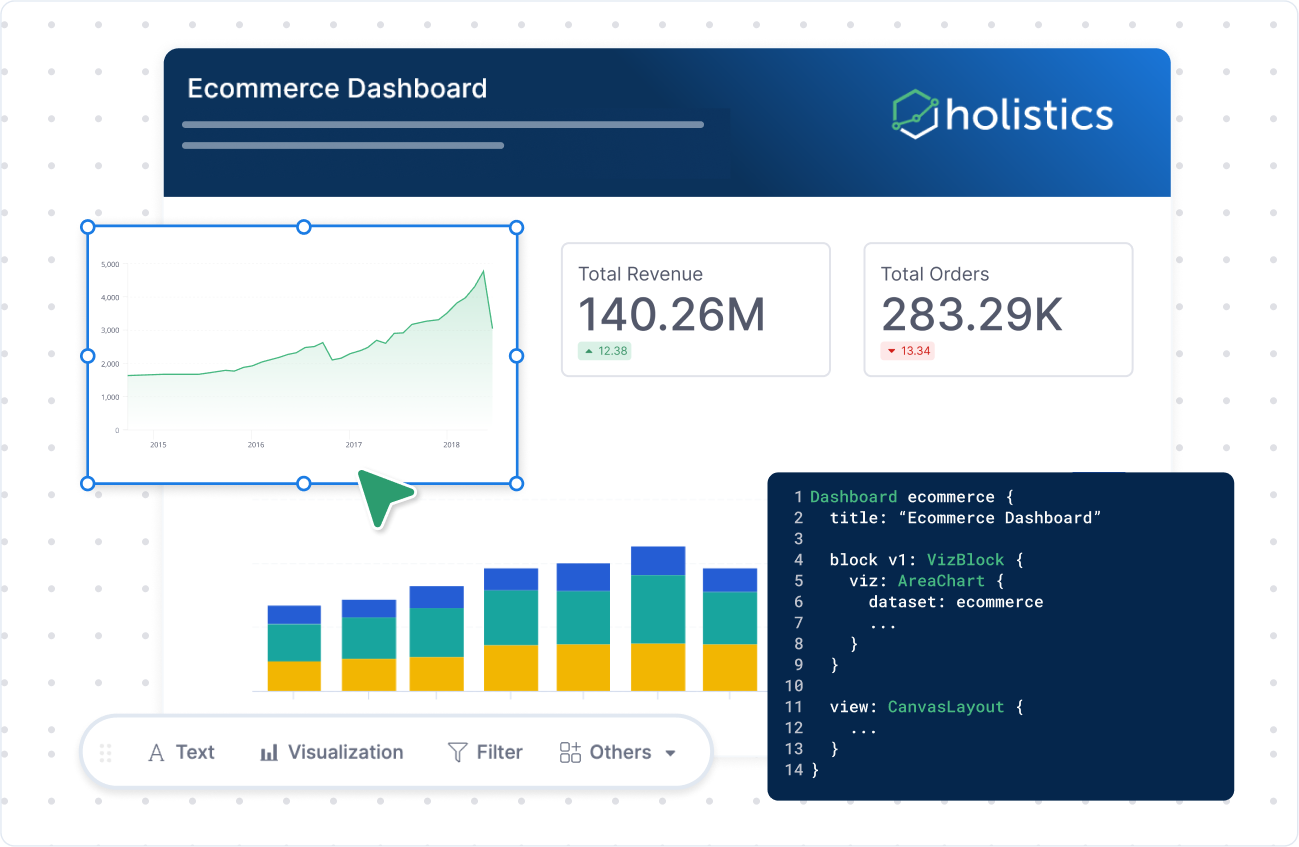
- Canvas Dashboard: A flexible canvas that generates code underneath the hood for analysts to easily maintain and scale your dashboard.
- Quick Dashboard: A simple, built for solo analysis, suitable when you need an ad-hoc report.
| Canvas Dashboard (Recommended) | Quick Dashboard (Legacy) | |
|---|---|---|
| Purpose | Build dashboards that scale and apply to teams, organizations | Create ad hoc data explorations and reports |
| Layout & Customization | Support multiple tabs, pixel-perfect layout, customizable themes, and mobile-friendly | Support single tab, and auto-layout |
| Collaboration | Has dedicated development workflow to ensure changes are reviewed | Changes applies automatically |
| Version control | Version control with Git integration | Not supported |
For detailed comparison, please refer to Compare Canvas Dashboard and Quick Dashboard
Dashboard editor
Dashboard editor is where you would be editing and viewing your dashboard. Depending on the types of dashboards you are choosing, the editor will be different.
- Canvas Dashboard
- Quick Dashboard

- Edit modes toggle: Change to your preferred editor mode, including Code, Dual, or Visual.
- Tabs: View and edit different views of your dashboard.
- Settings & Customization: View and edit dashboard settings such as Cache, Time zone, Themes, Preview by Device (Laptop/Mobile), and Filter Management.
- Code editor: View and edit your dashboard in code. Click Update to view changes in the Visual editor
- Visual editor: View and edit your dashboard in a GUI. Changes automatically update the dashboard code
- Toolbar: Add analytics blocks to enrich your Canvas Dashboard. You can drag the toolbar around the visual editor
- Zoom control: Configure the zoom level.
- Block’s context menu: When clicking on a block, a context menu appears on the top left corner of that block. It contains settings and operations relating to the selected block.

- Main editor: The main area to build the dashboard and apply interactive controls.
- Settings & Deliver data: Edit dashboard time zones, cache, other preferences, and deliver dashboard with export and shareable link.
- Convert to Canvas: Create another version in Canvas Dashboard. You will now have two dashboards: the original Quick Dashboard and the new Canvas Dashboard.
Building blocks
Building blocks are the Legos that sit on top of your workspace. Analytics blocks include: Text, Visualization, and Interactive Controls (such as Filters, Period Comparisons, and Date Drills). Together, these blocks allow you to present, engage with, and enhance the context of your data robustly.
Text Block

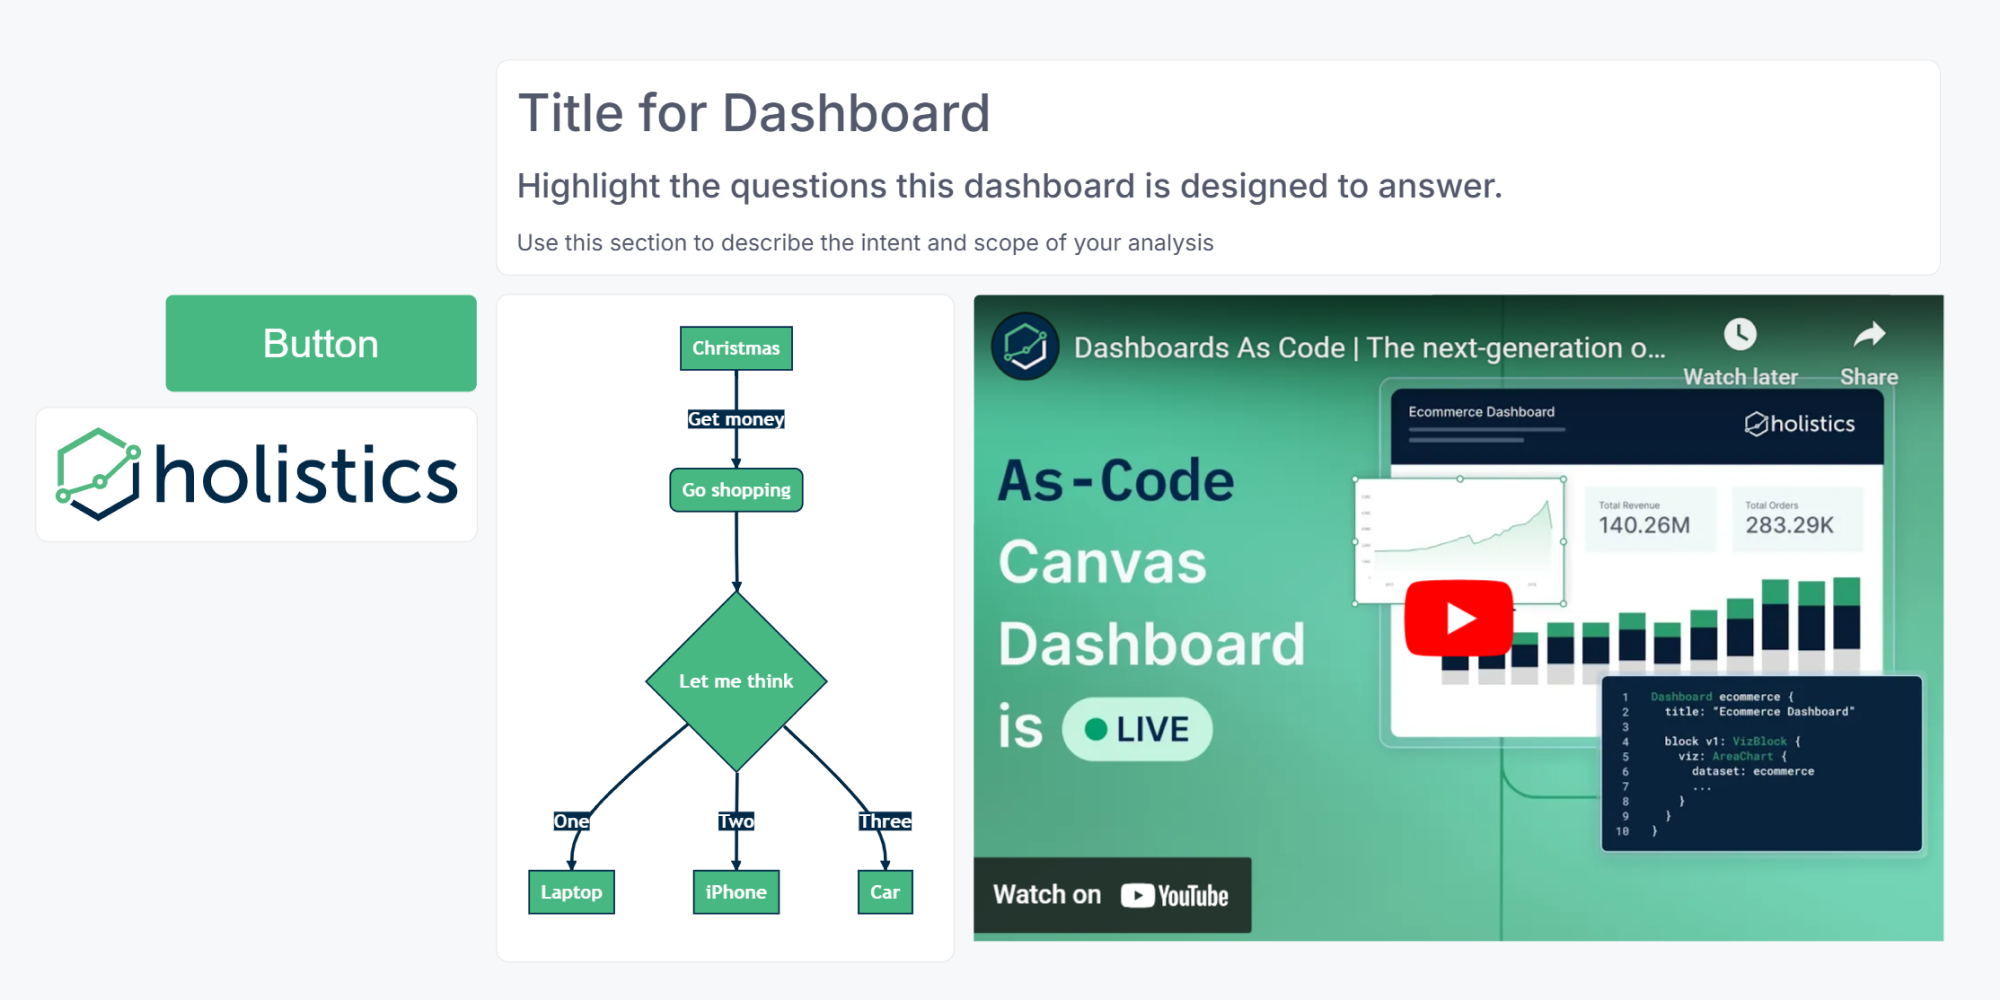
Text blocks allow you to incorporate context and information into your dashboard. They are Markdown-supported, which should serve your most common formatting requirements. You can use this to add text, images, or embed videos, etc.
For more information, you can refer to Text Block.
Visualization Block

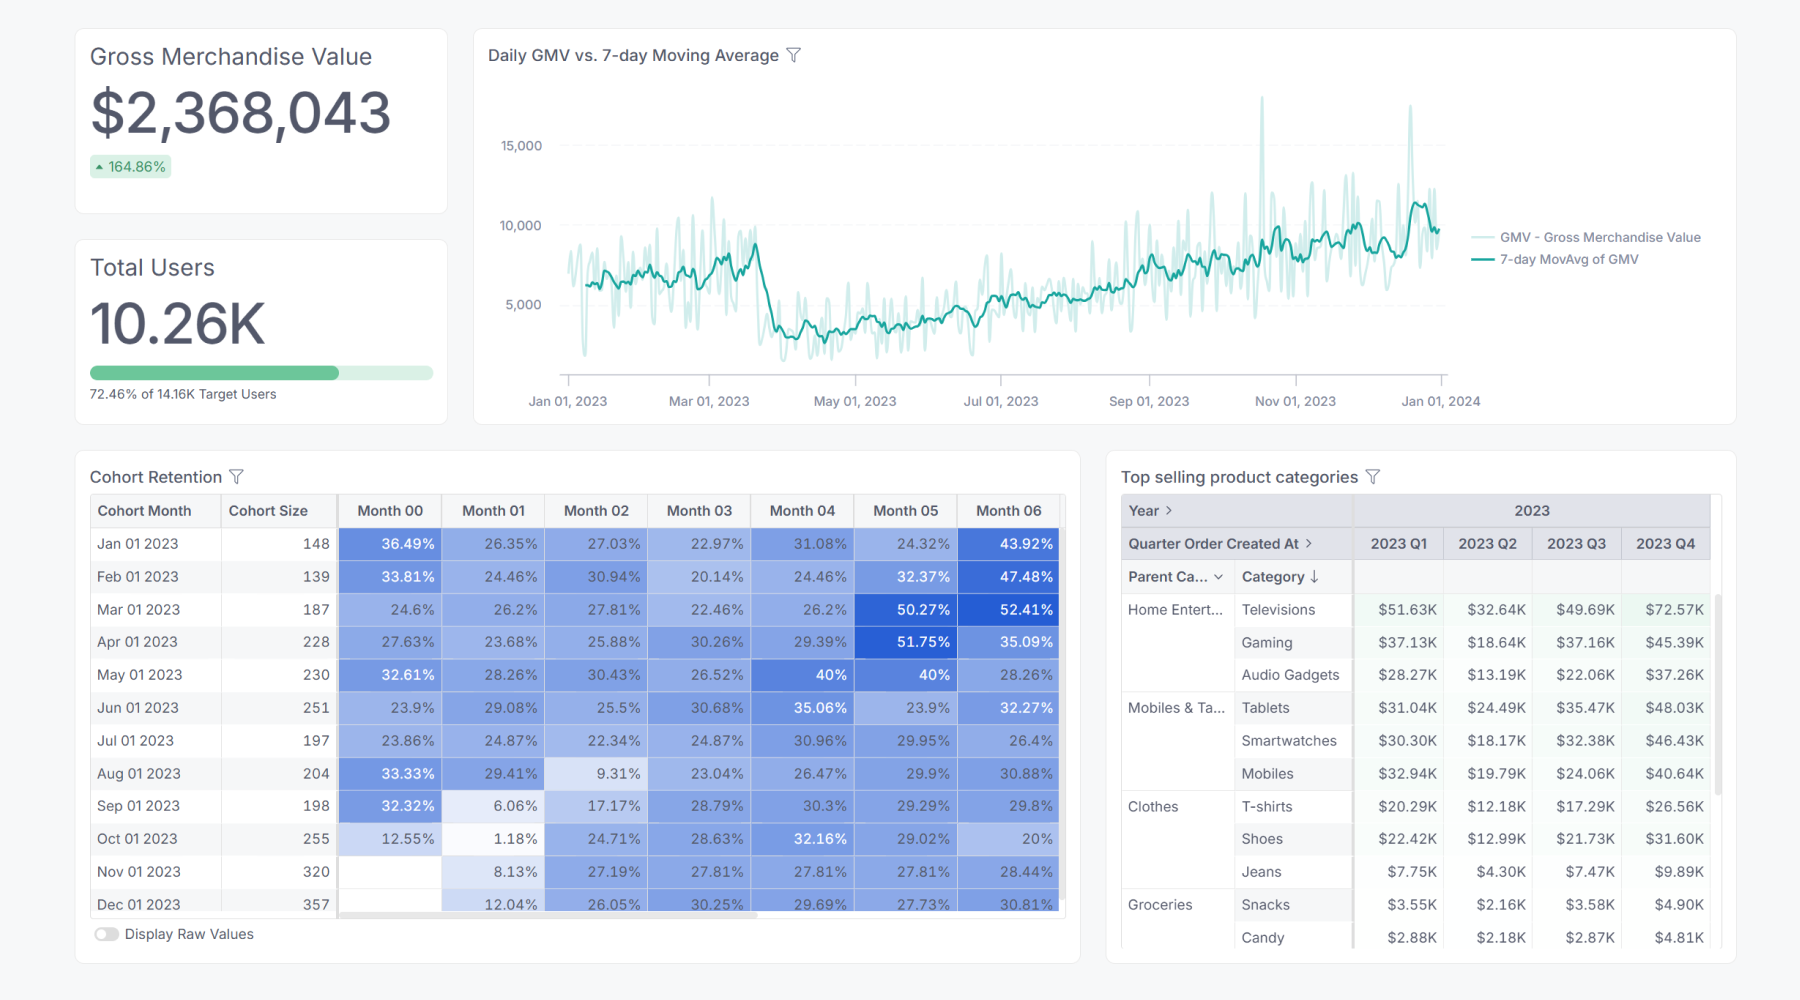
Visualization blocks allow you to add a variety of visualizations, including custom charts. Each block contains a single visualization. A dashboard can have multiple visualization blocks created from different datasets. Since it was backed by datasets, you can also freely explore the data of each block.
For more information, you can refer to Visualizations.
Interactive Control Block

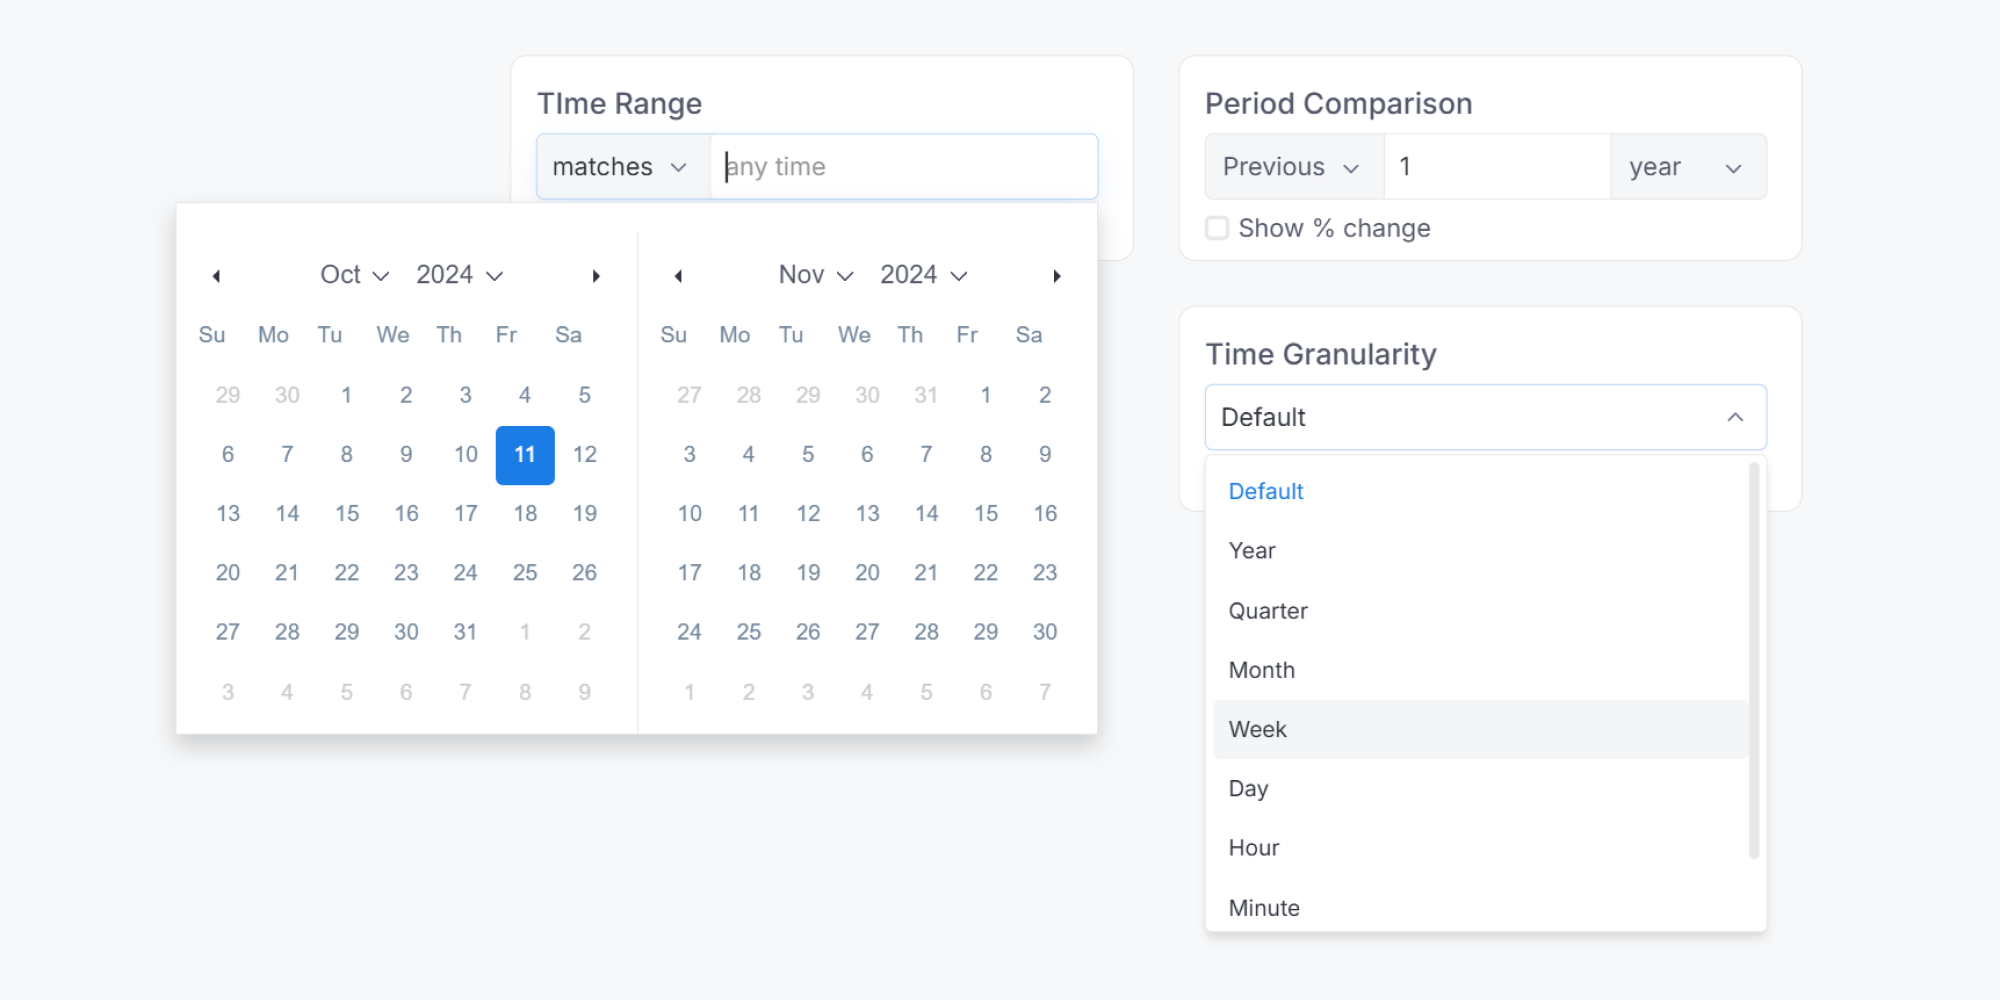
Interactive Control blocks — such as Filters, Period Comparisons, and Date Drills — allow you to manipulate data and add interactivity to your Dashboard.
- In Canvas Dashboard: You can move this block anywhere within the canvas.
- In Quick Dashboard: This block is fixed at the header of the dashboard.
For more information, you can refer to Filter, Period Comparison, Date Drill.
Reused blocks
Reused Blocks let you define a single “main block” and reference it in many dashboards. That way, you can build it once and reuse it multiple times, while having the flexibility to customize where needed.
For more information, you can refer to Reused blocks.
FAQs
How can we get access to the Canvas Dashboard?
The canvas dashboard is only available on Version 4.0. To get access to this kind of dashboard, you can migrate to our 4.0 version.
What would happen to my existing dashboards if I migrate from version 3.0 to 4.0 to get Canvas Dashboard?
There will be no changes. Version 4.0 supports both Canvas Dashboard and Quick Dashboards, so your existing dashboards will continue to work as expected.
However, we strongly recommend that you convert to Canvas Dashboard to unlock all of the as-code editing, greater flexibility, and advanced customization.
When will Quick Dashboard be deprecated, and what happens next?
While there is currently no finalized plan, we are considering the end of 2025 as the earliest potential timeframe for deprecating Quick Dashboard.
We will provide customers with at least 6 months’ advance notice before any deprecation occurs, once the timeline is confirmed.
Last updated: Jun 2025
How to generate a Canvas Dashboard from a Quick Dashboard?
- Available in Holistics Version 4.0.
- Requires Admin or Analyst permissions
Follow these steps:
- Open your existing Quick Dashboard
- Click Generate Canvas Dashboard
- Click Generate
A new Canvas Dashboard will be created in Development mode. Your original Quick Dashboard remains unchanged. You'll now have both the original Quick Dashboard and the new Canvas Dashboard as separate entities.
What’s the difference between Canvas Dashboard and Quick Dashboard?
| Canvas Dashboard | Quick Dashboard | |
|---|---|---|
| Development | ||
| Layout | Freely arrange visualizations, texts, filters, etc. anywhere on Canvas | Visualizations, and texts are arranged onto fixed-size grids. Filters and dashboard controls are always on top |
| As-code definition | Declarative AML as-code definition | Not supported |
| Reusability | Inherit AML’s reusability | Not supported |
| Version control | Version control with Git integration | Not supported |
| Development experience | Develop dashboard in Modeling layer Changes are applied after publishing to production | Develop dashboard in Reporting layer Changes are automatically applied |
| View & Interaction | ||
| Responsiveness & Scaling | Keep the dashboard ratio. Allow users to zoom in/out the dashboard to fit their screen. Control the size of canvas in pixels | Auto-resize the dashboard to fit the users’ screen. Dashboards look differently on different screens |
| Dashboard controls: Filters, Period Comparison, Date Drills | Place anywhere within dashboard Support easy reset to default values | Always stay on top of dashboard Manually reset to default values |
| Cross-filtering | Support ability to selectively apply/exclude cross-filtering to a subset of visualizations Cross-filtering triggers when clicking on Apply controls | When enabled, cross-filtering is applied to the whole dashboard (among visualizations using the same datasets) Cross-filtering automatically triggers on click |
| Drill-through | Support Drill-through between multiple Canvas Dashboards | Support Drill-through between multiple Quick Dashboard |
| Export | Export dashboard: Support export as PNG/PDF Export visualizations: Support export as PDF/Excel/csv | |
| Data Schedules | Support send to Email / Slack / Google Sheets / SFTP | |
| Data Alerts | Support send alerts to Email / Slack / Webhook | |
| Embedded Analytics | Support create Embed Link in Dashboard Preferences | |
| Explore data from dashboards | Admin, Analyst, and Explorer can explore a visualization in a dashboard, but CAN NOT save the exploration results | Admin, Analyst, and Explorer can explore a visualization in a dashboard, and save the exploration results to another dashboard |
| Private dashboards | Not supported | Admin, Analyst, and Explorer can create new dashboards in private workspace |